3 Stocks That May Be Undervalued By As Much As 46.1%
As the U.S. stock market navigates a mixed landscape, with recent rallies and shifts in major indices like the Dow Jones Industrial Average and S&P 500, investors are closely watching for opportunities amidst potential interest rate cuts and strong corporate earnings. In this environment, identifying undervalued stocks becomes crucial as they may offer significant growth potential when market conditions stabilize or improve.
Top 10 Undervalued Stocks Based On Cash Flows In The United States
| Name | Current Price | Fair Value (Est) | Discount (Est) |
| Wix.com (WIX) | $131.82 | $261.75 | 49.6% |
| SolarEdge Technologies (SEDG) | $34.30 | $67.51 | 49.2% |
| Peapack-Gladstone Financial (PGC) | $28.46 | $55.84 | 49% |
| Northwest Bancshares (NWBI) | $12.64 | $24.41 | 48.2% |
| Metropolitan Bank Holding (MCB) | $76.92 | $150.26 | 48.8% |
| Investar Holding (ISTR) | $23.42 | $46.20 | 49.3% |
| Fiverr International (FVRR) | $23.62 | $45.40 | 48% |
| Excelerate Energy (EE) | $24.51 | $46.79 | 47.6% |
| e.l.f. Beauty (ELF) | $118.15 | $224.96 | 47.5% |
| Customers Bancorp (CUBI) | $68.72 | $133.79 | 48.6% |
Click here to see the full list of 195 stocks from our Undervalued US Stocks Based On Cash Flows screener.
We'll examine a selection from our screener results.
DexCom (DXCM)
Overview: DexCom, Inc. is a medical device company specializing in the design, development, and commercialization of continuous glucose monitoring systems globally, with a market cap of approximately $32.26 billion.
Operations: The company generates revenue primarily from its continuous glucose monitoring systems, with the Patient Monitoring Equipment segment contributing $4.30 billion.
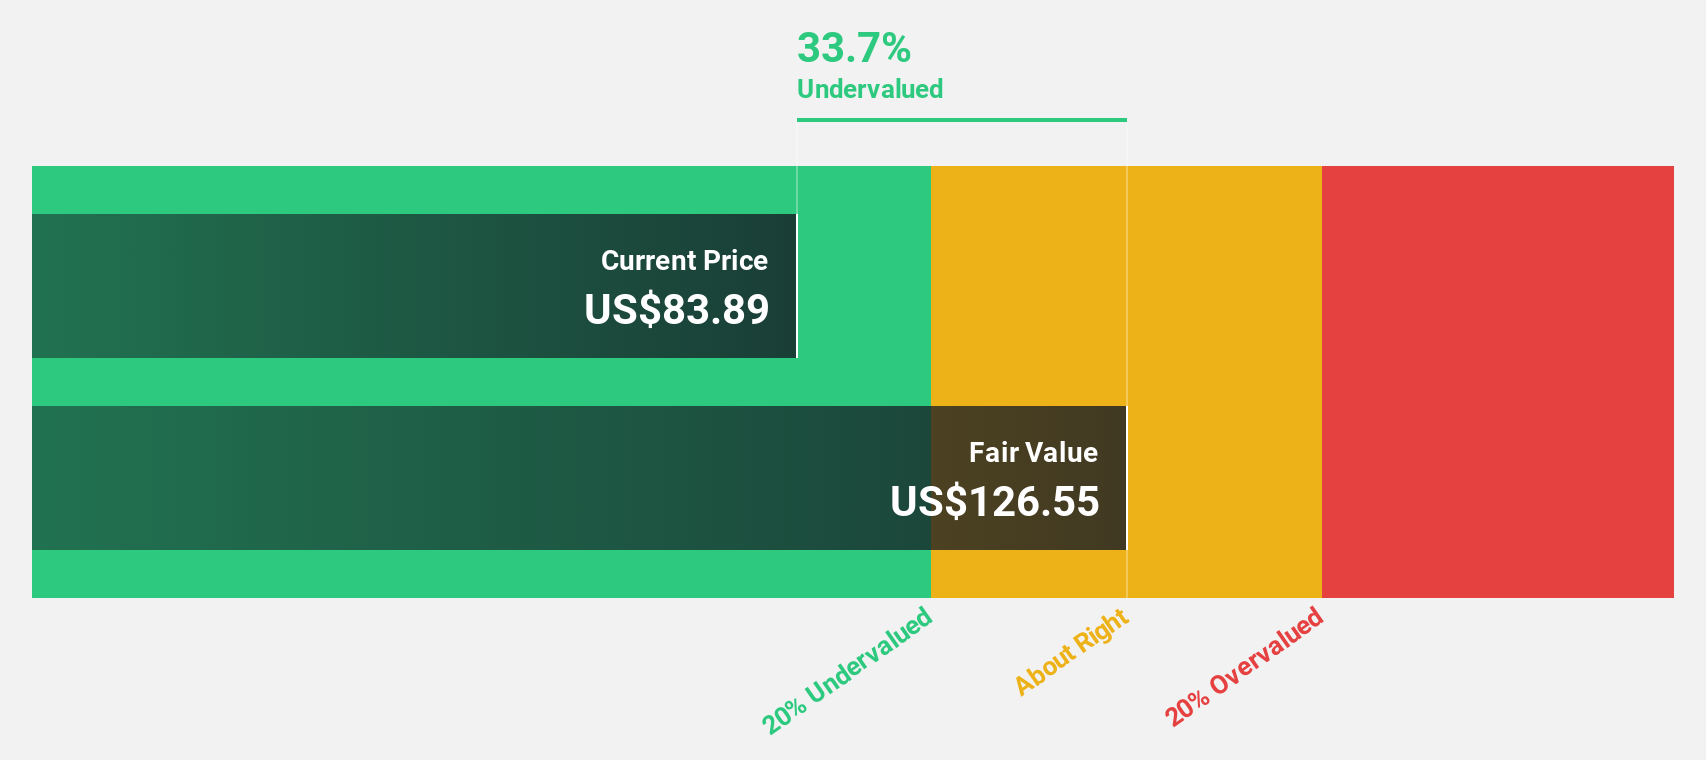
Estimated Discount To Fair Value: 29.7%
DexCom's recent financial performance and strategic initiatives position it as a potentially undervalued stock based on cash flows. The company reported strong revenue growth, with second-quarter sales reaching US$1.16 billion, up from US$1 billion the previous year, and raised its 2025 revenue guidance to between US$4.6 billion and US$4.625 billion. Despite legal challenges regarding trademark issues, DexCom continues to innovate with AI-powered features in its glucose monitoring systems, enhancing user engagement and market reach.
- Insights from our recent growth report point to a promising forecast for DexCom's business outlook.
- Click to explore a detailed breakdown of our findings in DexCom's balance sheet health report.
Old National Bancorp (ONB)
Overview: Old National Bancorp is a bank holding company for Old National Bank, offering consumer and commercial banking services in the United States, with a market cap of approximately $8.90 billion.
Operations: The company generates revenue primarily from its Community Banking segment, which accounts for approximately $1.89 billion.
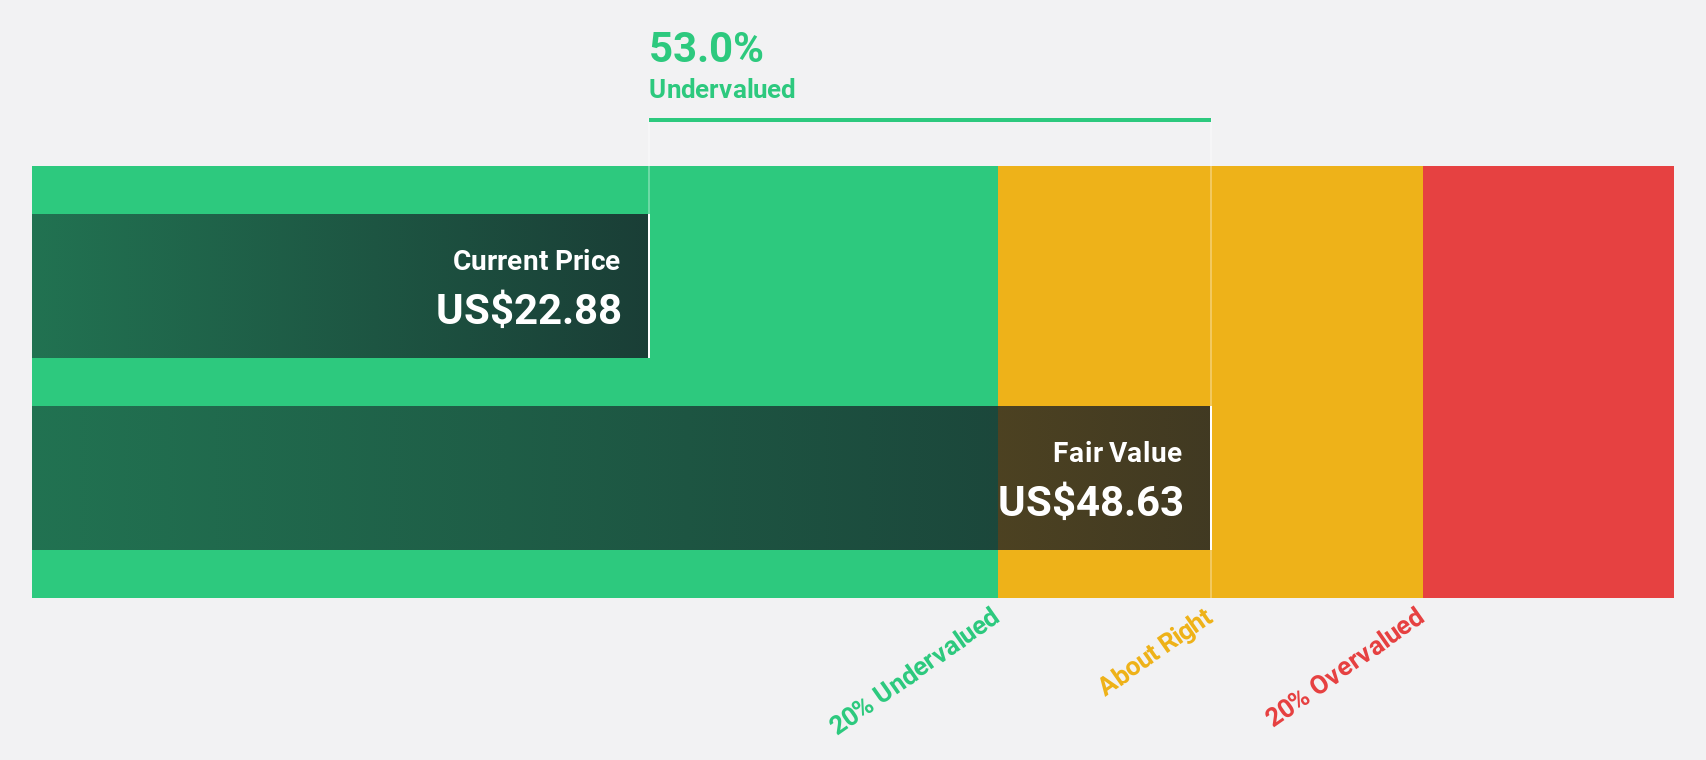
Estimated Discount To Fair Value: 44.1%
Old National Bancorp appears undervalued based on cash flows, trading at US$22.72, below its estimated fair value of US$40.62. The company reported a net interest income increase to US$514.79 million in Q2 2025 from the previous year's US$388.42 million, reflecting strong cash flow generation despite higher net charge-offs of US$26.53 million compared to last year’s US$14.05 million and recent shareholder dilution impacting equity returns forecasts negatively.
- Our growth report here indicates Old National Bancorp may be poised for an improving outlook.
- Delve into the full analysis health report here for a deeper understanding of Old National Bancorp.
UMB Financial (UMBF)
Overview: UMB Financial Corporation is a bank holding company offering banking services and asset servicing both in the United States and internationally, with a market cap of $9.23 billion.
Operations: The company's revenue segments include Personal Banking at $335.35 million, Commercial Banking at $965.43 million, and Institutional Banking (including Healthcare Services) at $648.57 million.
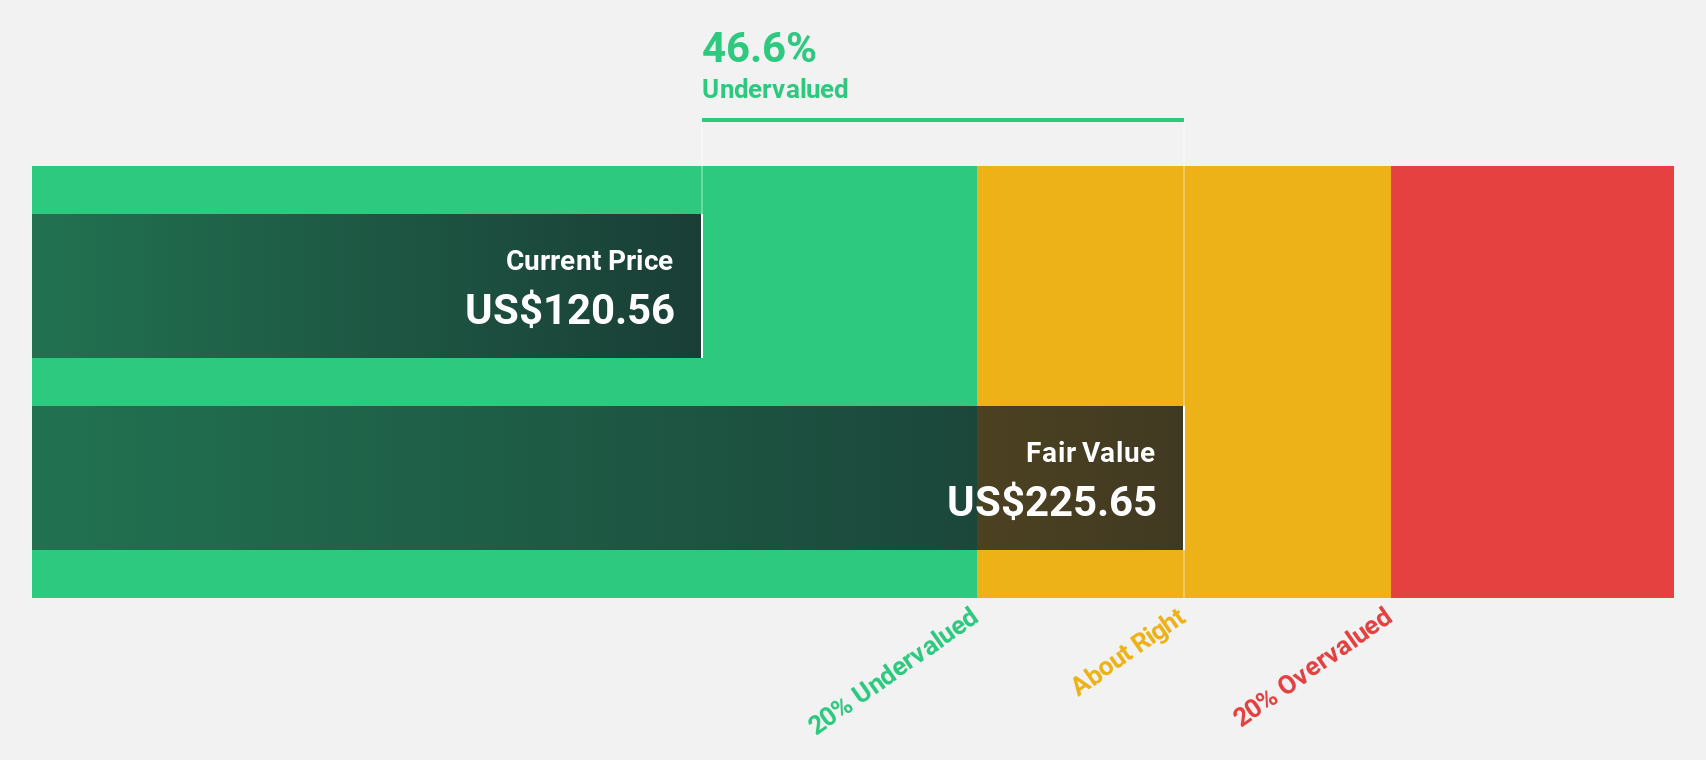
Estimated Discount To Fair Value: 46.1%
UMB Financial is trading at US$121.59, significantly below its estimated fair value of US$225.65, indicating potential undervaluation based on cash flows. Despite recent shareholder dilution and net charge-offs of US$15.5 million in Q2 2025, the company reported robust net interest income growth to US$467.02 million from the previous year's US$245.11 million, showcasing strong cash flow generation and an anticipated earnings growth rate surpassing the broader market expectations.
- Our comprehensive growth report raises the possibility that UMB Financial is poised for substantial financial growth.
- Click here and access our complete balance sheet health report to understand the dynamics of UMB Financial.
Taking Advantage
- Click this link to deep-dive into the 195 companies within our Undervalued US Stocks Based On Cash Flows screener.
- Have you diversified into these companies? Leverage the power of Simply Wall St's portfolio to keep a close eye on market movements affecting your investments.
- Join a community of smart investors by using Simply Wall St. It's free and delivers expert-level analysis on worldwide markets.
Searching for a Fresh Perspective?
- Explore high-performing small cap companies that haven't yet garnered significant analyst attention.
- Diversify your portfolio with solid dividend payers offering reliable income streams to weather potential market turbulence.
- Fuel your portfolio with companies showing strong growth potential, backed by optimistic outlooks both from analysts and management.
This article by Simply Wall St is general in nature. We provide commentary based on historical data and analyst forecasts only using an unbiased methodology and our articles are not intended to be financial advice. It does not constitute a recommendation to buy or sell any stock, and does not take account of your objectives, or your financial situation. We aim to bring you long-term focused analysis driven by fundamental data. Note that our analysis may not factor in the latest price-sensitive company announcements or qualitative material. Simply Wall St has no position in any stocks mentioned.
New: Manage All Your Stock Portfolios in One Place
We've created the ultimate portfolio companion for stock investors, and it's free.
• Connect an unlimited number of Portfolios and see your total in one currency• Be alerted to new Warning Signs or Risks via email or mobile• Track the Fair Value of your stocks
Try a Demo Portfolio for FreeHave feedback on this article? Concerned about the content? Get in touch with us directly. Alternatively, email editorial-team@simplywallst.com
Disclaimer: Investing carries risk. This is not financial advice. The above content should not be regarded as an offer, recommendation, or solicitation on acquiring or disposing of any financial products, any associated discussions, comments, or posts by author or other users should not be considered as such either. It is solely for general information purpose only, which does not consider your own investment objectives, financial situations or needs. TTM assumes no responsibility or warranty for the accuracy and completeness of the information, investors should do their own research and may seek professional advice before investing.
Most Discussed
- 1
- 2
- 3
- 4
- 5
- 6
- 7
- 8
- 9
- 10