Should You Revisit PACCAR After Its Recent 5.7% Rebound and Strong Earnings Growth?
Thinking about what to do with PACCAR stock right now? You are not alone. Plenty of investors are eyeing this industrial leader and wondering whether all that long-term growth is already baked into the price, or if there is more upside waiting. The journey of PACCAR’s share price in the last year has been anything but boring. Despite some dips, the stock is still up nearly 6.5% over the past year and has more than doubled over the last five years—a seriously strong showing for a company in the capital goods space.
Over the past month, shares have rebounded by about 5.7%. Even though this year-to-date return is slightly in the red, long-term returns remain stellar. That recent uptick could signal shifting investor sentiment, potentially due to steady revenue growth and a significant jump in net income, with over 11% in annual net income growth. With the last close at $98.18 and still trading a little over 6% below the average analyst price target, some see room for cautious optimism.
On the value front, the company scores a 3 out of 6 based on classic undervaluation checks. This is a mixed verdict, but worth investigating further. Let us dig into those valuation approaches. Later, we will look at one perspective that could give the clearest picture yet on what PACCAR is truly worth.
PACCAR delivered 6.5% returns over the last year. See how this stacks up to the rest of the Machinery industry.Approach 1: PACCAR Cash Flows
The Discounted Cash Flow (DCF) model estimates what a business is worth by projecting its future free cash flows and then discounting those amounts back to today’s value. This approach aims to capture the true, intrinsic value of a stock beyond short-term fluctuations by focusing on the underlying financial data.
PACCAR’s latest twelve-month free cash flow is $3.1 billion. Projections indicate these cash flows will remain solid, with estimates of about $3.07 billion by 2029. Analysts provide a range of future yearly cash flow forecasts, with consistent figures through the end of the next decade. Based on these figures, the DCF model assigns an intrinsic fair value of $74.70 per share to PACCAR using a two-stage Free Cash Flow to Equity valuation.
When compared to PACCAR’s recent share price of $98.18, the DCF suggests the company is 31.4% overvalued. In other words, from a cash flow perspective, PACCAR’s current price reflects much or all of its projected growth, as well as an additional premium.
Result: OVERVALUED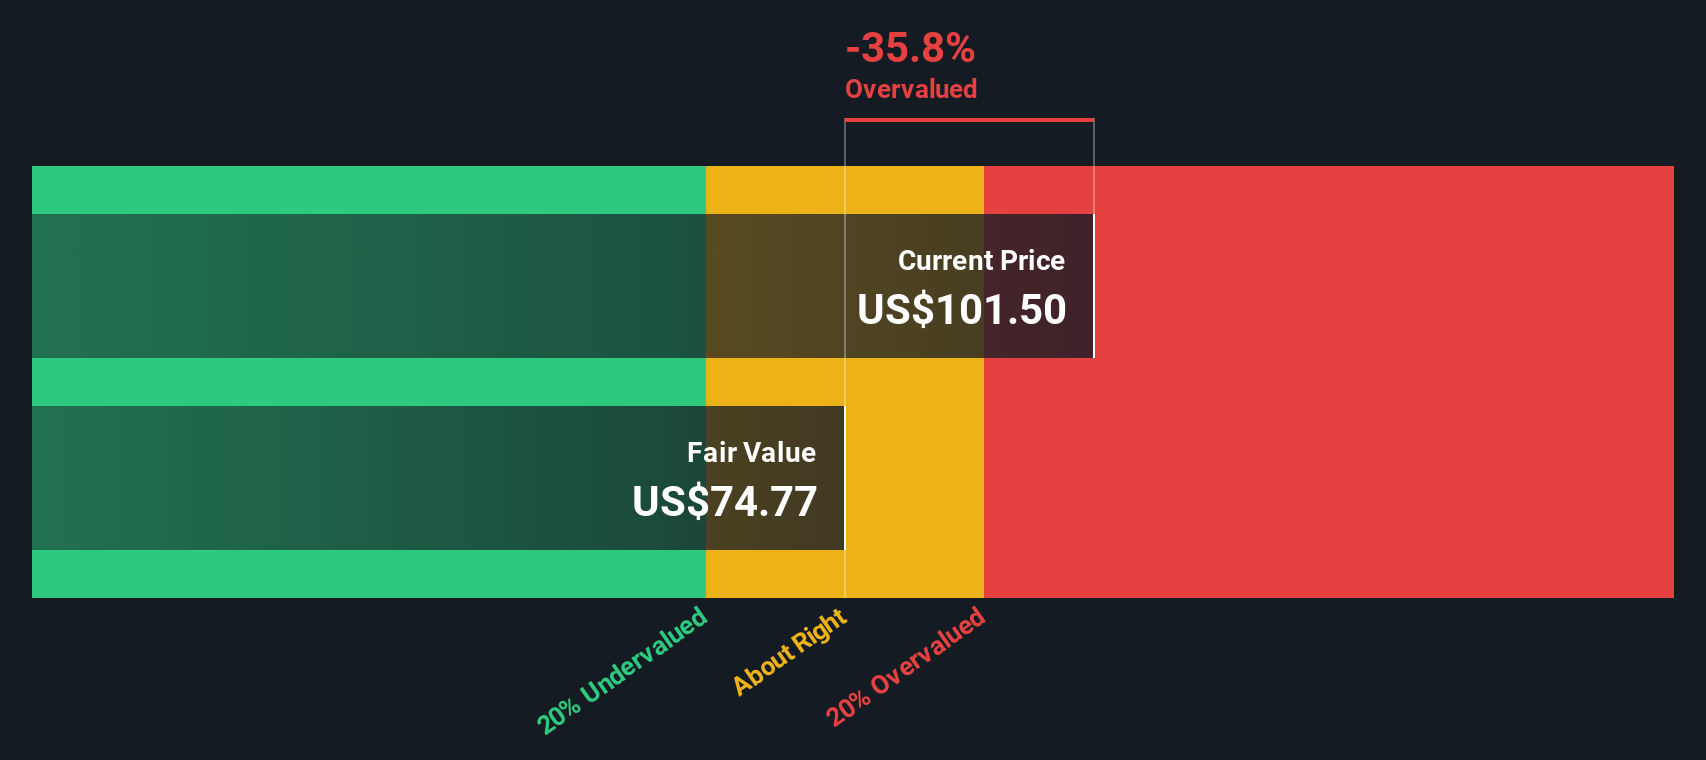
Approach 2: PACCAR Price vs Earnings
For well-established, profitable companies like PACCAR, the Price-to-Earnings (PE) ratio is often the go-to metric for valuation. The PE ratio helps investors gauge what the market is willing to pay for each dollar of earnings. This makes it particularly relevant when a company has a steady track record of profitability.
Growth expectations and risk play a significant role in determining what constitutes a “normal” or “fair” PE ratio. High-growth firms or those with more predictable earnings often warrant higher PE multiples, as investors are more confident in future profit streams. In contrast, companies facing industry headwinds or higher risks tend to trade at a discount to the average PE.
PACCAR’s current PE ratio stands at 16.8x. When compared to the Machinery industry average of 23.9x and a peer group average of 20.4x, PACCAR trades at a noticeable discount. Simply Wall St has developed a Fair Ratio for PACCAR, which takes into account its earnings growth, industry standing, margins, and risk profile. That Fair Ratio is calculated at 28.3x. With PACCAR currently trading well below this figure, the implication is that the stock may be undervalued when assessed using the PE ratio.
Result: UNDERVALUED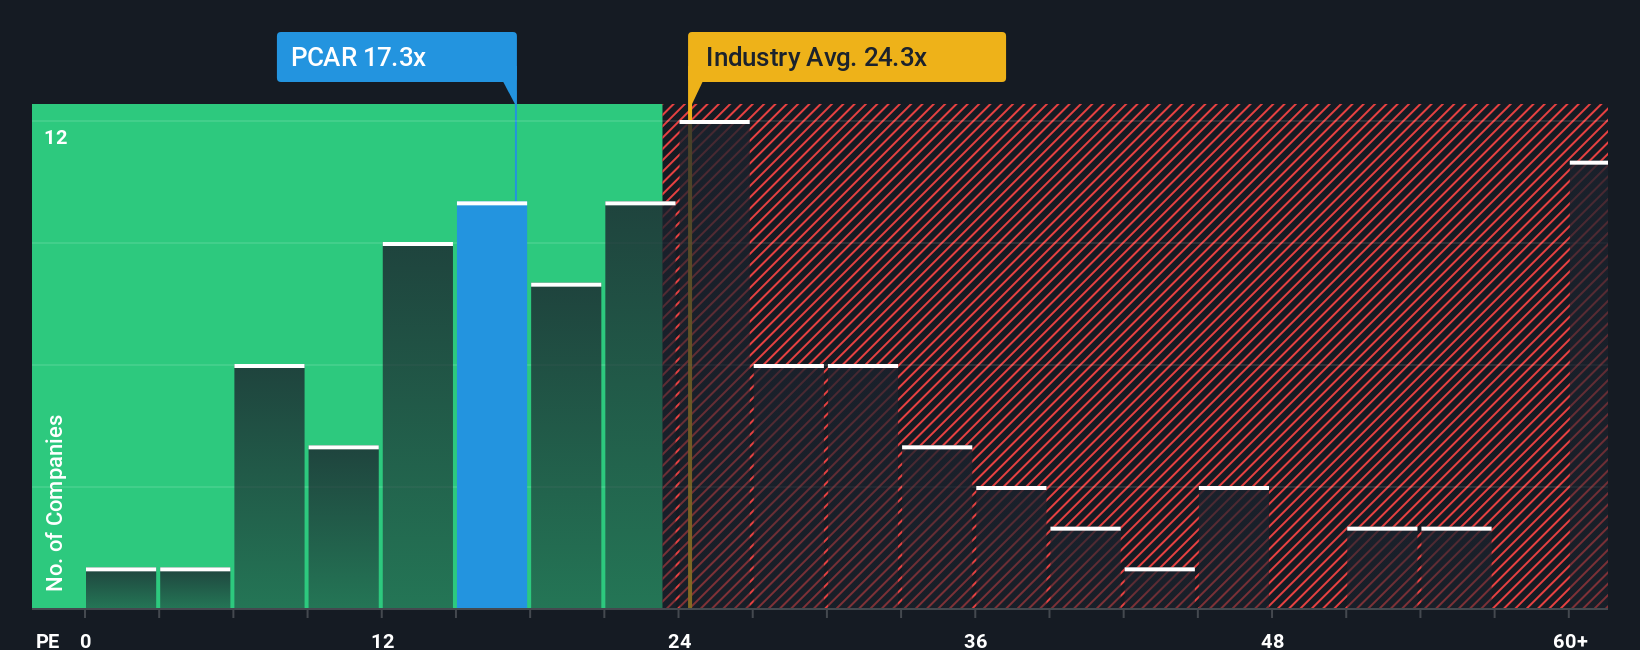
Upgrade Your Decision Making: Choose your PACCAR Narrative
Beyond numbers and ratios, investment decisions become much clearer when you add a “Narrative”—simply put, your story behind the numbers—about where PACCAR is headed and why you believe it deserves a certain valuation.
In the investing world, a Narrative links your take on the company’s business, industry drivers, and future prospects directly to detailed forecasts, which then roll up into a fair value. This approach transforms raw data into something meaningful and actionable, giving you a framework for knowing when the price is right to buy, hold, or sell.
On platforms like Simply Wall St, Narratives are especially accessible. Investors can instantly connect their insights, test future revenue and earnings assumptions, and see how their fair value compares to others in a vibrant community of millions. Because Narratives update automatically when news or earnings reports come in, your analysis always reflects the latest facts, not guesswork or outdated info.
For example, one investor might have a bullish Narrative that PACCAR’s cutting-edge technology and new regulations will drive earnings up, backing a price target of $131. Another might take a cautious view on regulatory risk and margins, landing at $86. This allows you to directly weigh optimism against skepticism as you make your own call.
Do you think there's more to the story for PACCAR? Create your own Narrative to let the Community know!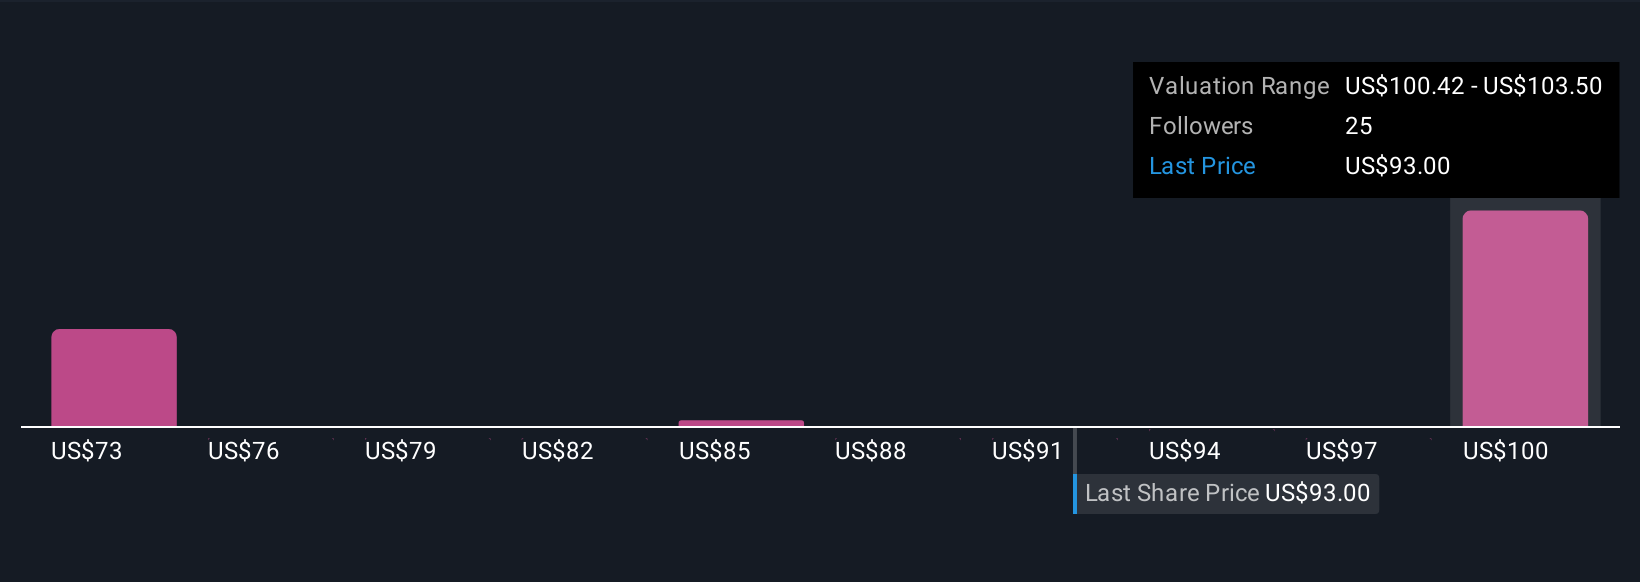
This article by Simply Wall St is general in nature. We provide commentary based on historical data and analyst forecasts only using an unbiased methodology and our articles are not intended to be financial advice. It does not constitute a recommendation to buy or sell any stock, and does not take account of your objectives, or your financial situation. We aim to bring you long-term focused analysis driven by fundamental data. Note that our analysis may not factor in the latest price-sensitive company announcements or qualitative material. Simply Wall St has no position in any stocks mentioned.
New: Manage All Your Stock Portfolios in One Place
We've created the ultimate portfolio companion for stock investors, and it's free.
• Connect an unlimited number of Portfolios and see your total in one currency• Be alerted to new Warning Signs or Risks via email or mobile• Track the Fair Value of your stocks
Try a Demo Portfolio for FreeHave feedback on this article? Concerned about the content? Get in touch with us directly. Alternatively, email editorial-team@simplywallst.com
Disclaimer: Investing carries risk. This is not financial advice. The above content should not be regarded as an offer, recommendation, or solicitation on acquiring or disposing of any financial products, any associated discussions, comments, or posts by author or other users should not be considered as such either. It is solely for general information purpose only, which does not consider your own investment objectives, financial situations or needs. TTM assumes no responsibility or warranty for the accuracy and completeness of the information, investors should do their own research and may seek professional advice before investing.
Most Discussed
- 1
- 2
- 3
- 4
- 5
- 6
- 7
- 8
- 9
- 10