Southern Cross Electrical Engineering Full Year 2025 Earnings: EPS: AU$0.12 (vs AU$0.083 in FY 2024)
Southern Cross Electrical Engineering (ASX:SXE) Full Year 2025 Results
Key Financial Results
- Revenue: AU$801.5m (up 45% from FY 2024).
- Net income: AU$31.7m (up 45% from FY 2024).
- Profit margin: 4.0% (in line with FY 2024).
- EPS: AU$0.12 (up from AU$0.083 in FY 2024).
Trump has pledged to "unleash" American oil and gas and these 15 US stocks have developments that are poised to benefit.
All figures shown in the chart above are for the trailing 12 month (TTM) period
Southern Cross Electrical Engineering Earnings Insights
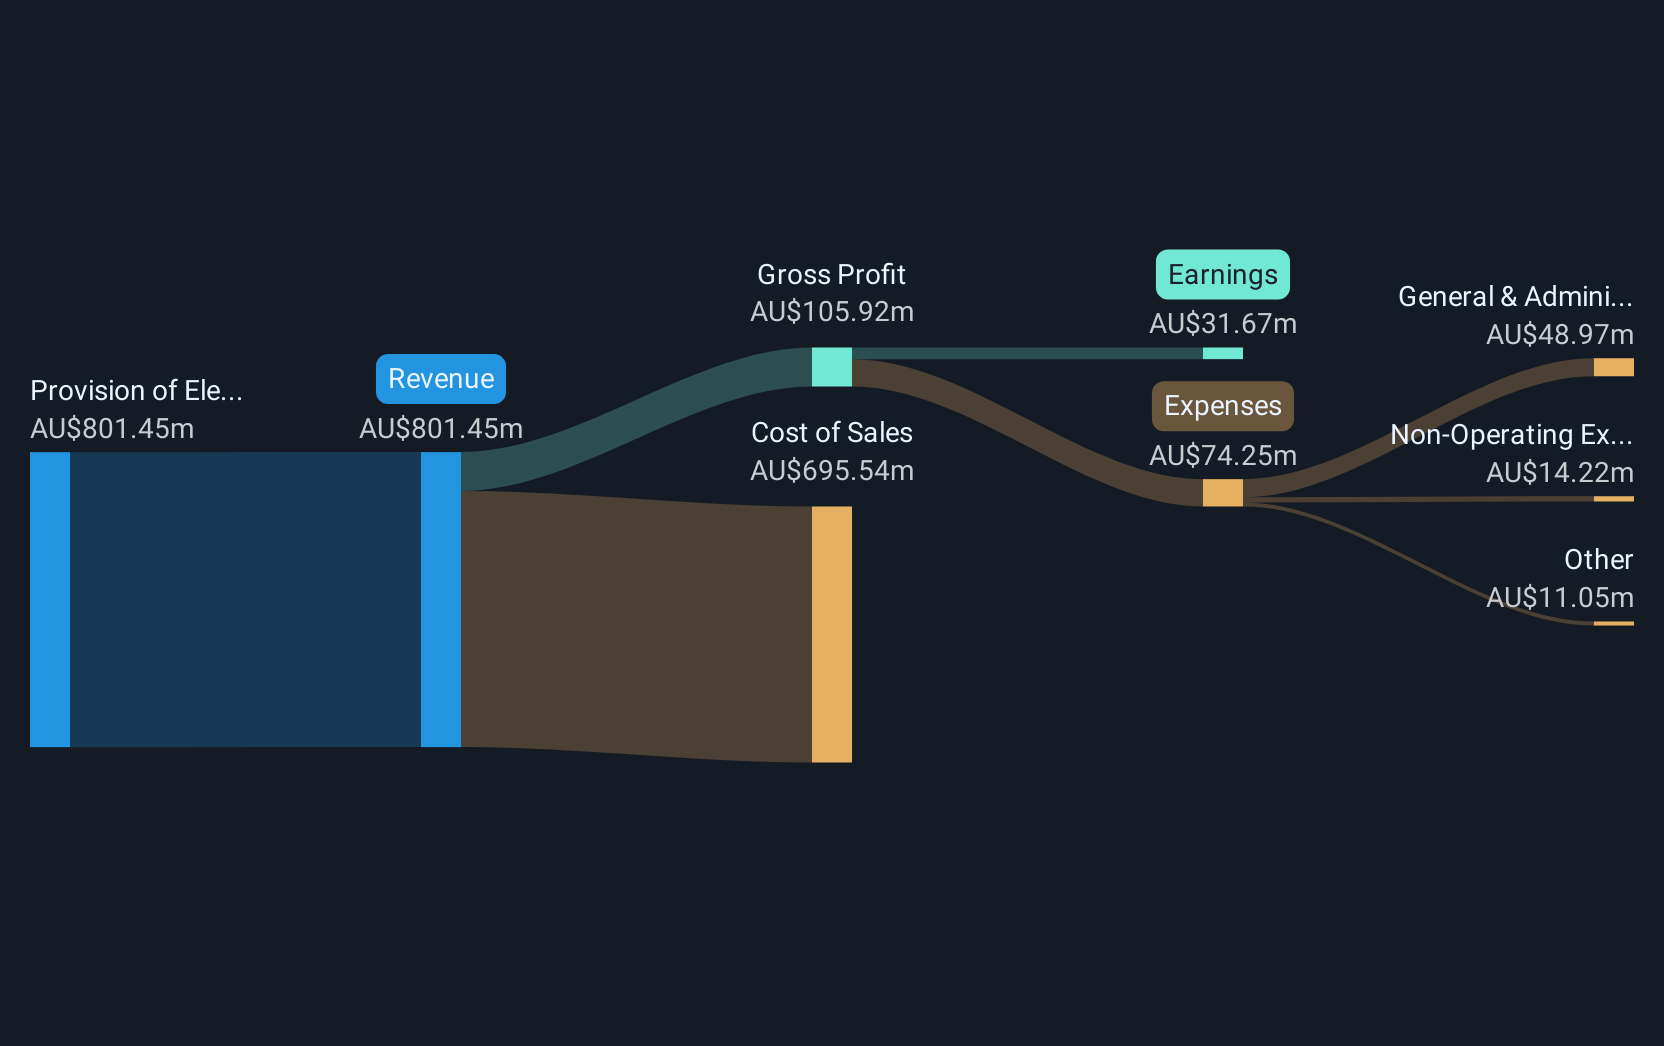
In the last 12 months, the only revenue segment was Provision of Electrical Services contributing AU$801.5m. Notably, cost of sales worth AU$695.5m amounted to 87% of total revenue thereby underscoring the impact on earnings. The largest operating expense was General & Administrative costs, amounting to AU$49.0m (66% of total expenses). Explore how SXE's revenue and expenses shape its earnings.
Looking ahead, revenue is forecast to grow 7.2% p.a. on average during the next 3 years, compared to a 7.2% growth forecast for the Construction industry in Australia.
Performance of the Australian Construction industry.
The company's shares are down 6.0% from a week ago.
Risk Analysis
Don't forget that there may still be risks. For instance, we've identified 1 warning sign for Southern Cross Electrical Engineering that you should be aware of.
New: Manage All Your Stock Portfolios in One Place
We've created the ultimate portfolio companion for stock investors, and it's free.
• Connect an unlimited number of Portfolios and see your total in one currency• Be alerted to new Warning Signs or Risks via email or mobile• Track the Fair Value of your stocks
Try a Demo Portfolio for FreeHave feedback on this article? Concerned about the content? Get in touch with us directly. Alternatively, email editorial-team (at) simplywallst.com.This article by Simply Wall St is general in nature. We provide commentary based on historical data and analyst forecasts only using an unbiased methodology and our articles are not intended to be financial advice. It does not constitute a recommendation to buy or sell any stock, and does not take account of your objectives, or your financial situation. We aim to bring you long-term focused analysis driven by fundamental data. Note that our analysis may not factor in the latest price-sensitive company announcements or qualitative material. Simply Wall St has no position in any stocks mentioned.
Disclaimer: Investing carries risk. This is not financial advice. The above content should not be regarded as an offer, recommendation, or solicitation on acquiring or disposing of any financial products, any associated discussions, comments, or posts by author or other users should not be considered as such either. It is solely for general information purpose only, which does not consider your own investment objectives, financial situations or needs. TTM assumes no responsibility or warranty for the accuracy and completeness of the information, investors should do their own research and may seek professional advice before investing.
Most Discussed
- 1
- 2
- 3
- 4
- 5
- 6
- 7
- 8
- 9
- 10