Three Companies That Might Be Priced Below Their Estimated Value
As the U.S. stock market hovers near record highs, investors are closely watching for signals from the Federal Reserve and upcoming retail sector earnings to gauge future economic directions. In such an environment, identifying stocks that might be priced below their estimated value can offer opportunities for those looking to invest wisely amidst fluctuating interest rate expectations and consumer spending patterns.
Top 10 Undervalued Stocks Based On Cash Flows In The United States
| Name | Current Price | Fair Value (Est) | Discount (Est) |
| UMB Financial (UMBF) | $115.67 | $225.65 | 48.7% |
| Udemy (UDMY) | $6.96 | $13.23 | 47.4% |
| StoneCo (STNE) | $15.44 | $29.30 | 47.3% |
| Royal Gold (RGLD) | $171.55 | $329.41 | 47.9% |
| Lyft (LYFT) | $16.02 | $30.95 | 48.2% |
| Granite Ridge Resources (GRNT) | $5.31 | $10.24 | 48.1% |
| Fiverr International (FVRR) | $23.62 | $44.95 | 47.5% |
| First Commonwealth Financial (FCF) | $16.79 | $32.97 | 49.1% |
| First Busey (BUSE) | $23.19 | $45.40 | 48.9% |
| Dime Community Bancshares (DCOM) | $28.67 | $56.56 | 49.3% |
Click here to see the full list of 193 stocks from our Undervalued US Stocks Based On Cash Flows screener.
Let's explore several standout options from the results in the screener.
Alnylam Pharmaceuticals (ALNY)
Overview: Alnylam Pharmaceuticals, Inc. is a biotechnology company that discovers, develops, and commercializes therapeutics based on ribonucleic acid interference with a market cap of approximately $58.84 billion.
Operations: The company's revenue is primarily derived from its activities in the discovery, development, and commercialization of RNAi therapeutics, totaling $2.46 billion.
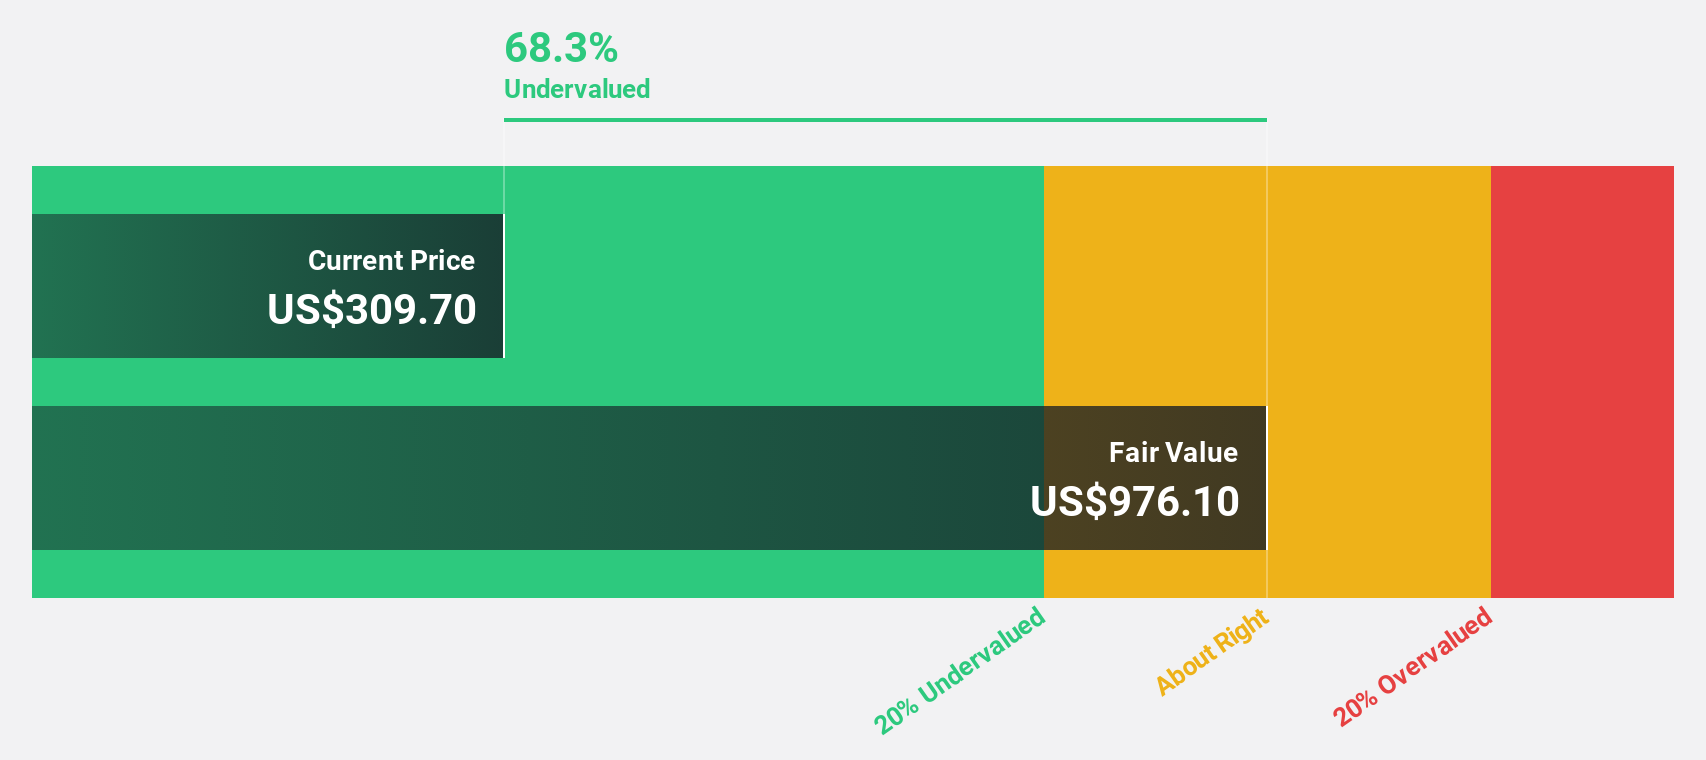
Estimated Discount To Fair Value: 14.0%
Alnylam Pharmaceuticals is trading at 14% below its estimated fair value of US$531.31, suggesting potential undervaluation based on cash flows. Recent earnings guidance revision indicates stronger revenue expectations, with net product revenues projected between US$2.65 billion to US$2.8 billion for 2025. Despite a current net loss, the company is expected to achieve profitability within three years, driven by high forecasted revenue growth of 25.8% annually and robust return on equity projections reaching very high levels in the future.
- Our earnings growth report unveils the potential for significant increases in Alnylam Pharmaceuticals' future results.
- Click to explore a detailed breakdown of our findings in Alnylam Pharmaceuticals' balance sheet health report.
Synopsys (SNPS)
Overview: Synopsys, Inc. specializes in electronic design automation software for designing and testing integrated circuits, with a market cap of $114.34 billion.
Operations: The company's revenue is primarily derived from Design Automation, generating $4.32 billion, and Design IP, contributing $1.90 billion.
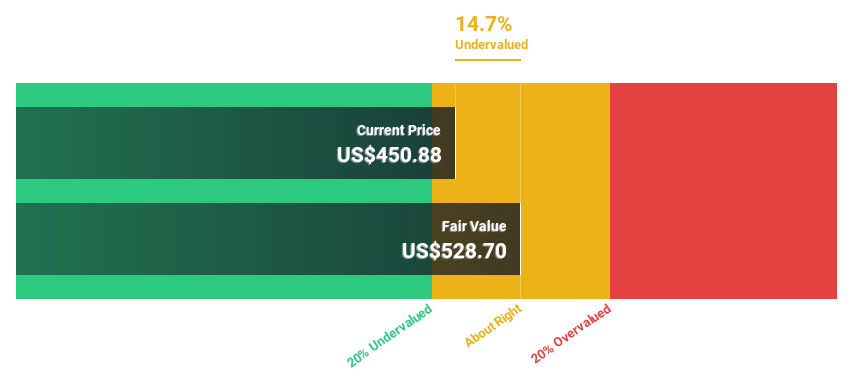
Estimated Discount To Fair Value: 14.8%
Synopsys is trading 14.8% below its estimated fair value of US$733.82, indicating potential undervaluation based on cash flows. The company's earnings are projected to grow at a significant rate of 23.8% annually, outpacing the broader US market's growth expectations. Recent strategic collaborations in AI and automotive sectors enhance Synopsys' position in expanding markets, while its acquisition of Ansys broadens its total addressable market to US$31 billion, potentially supporting future revenue growth above market averages.
- In light of our recent growth report, it seems possible that Synopsys' financial performance will exceed current levels.
- Get an in-depth perspective on Synopsys' balance sheet by reading our health report here.
Dayforce (DAY)
Overview: Dayforce Inc. is a human capital management software company operating in the United States, Canada, Australia, and internationally with a market cap of $8.44 billion.
Operations: The company generates revenue primarily through its Human Capital Management (HCM) segment, which accounted for $1.85 billion.
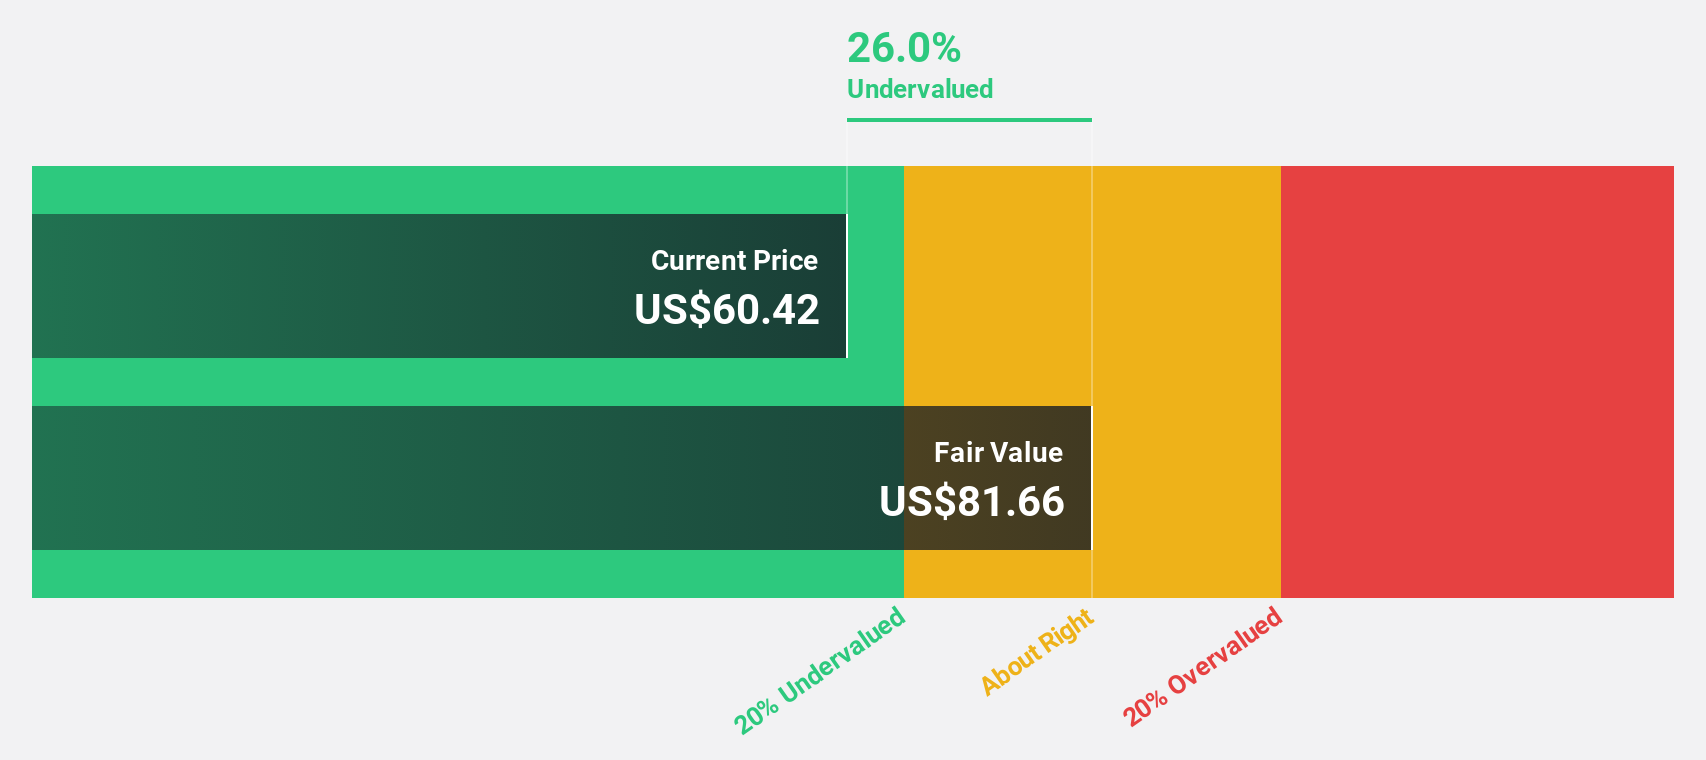
Estimated Discount To Fair Value: 31.2%
Dayforce is trading at US$66.62, significantly below its fair value estimate of US$96.83, suggesting it is undervalued based on cash flows. Earnings have grown 31.6% annually over five years and are forecast to rise by 36.9% per year, surpassing the broader US market's growth expectations. Recent earnings showed a substantial turnaround with a net income of US$21.3 million from a previous loss, while M&A rumors involving Thoma Bravo could impact future valuations and strategic direction.
- Our comprehensive growth report raises the possibility that Dayforce is poised for substantial financial growth.
- Click here to discover the nuances of Dayforce with our detailed financial health report.
Next Steps
- Unlock our comprehensive list of 193 Undervalued US Stocks Based On Cash Flows by clicking here.
- Shareholder in one or more of these companies? Ensure you're never caught off-guard by adding your portfolio in Simply Wall St for timely alerts on significant stock developments.
- Simply Wall St is a revolutionary app designed for long-term stock investors, it's free and covers every market in the world.
Contemplating Other Strategies?
- Explore high-performing small cap companies that haven't yet garnered significant analyst attention.
- Diversify your portfolio with solid dividend payers offering reliable income streams to weather potential market turbulence.
- Fuel your portfolio with companies showing strong growth potential, backed by optimistic outlooks both from analysts and management.
This article by Simply Wall St is general in nature. We provide commentary based on historical data and analyst forecasts only using an unbiased methodology and our articles are not intended to be financial advice. It does not constitute a recommendation to buy or sell any stock, and does not take account of your objectives, or your financial situation. We aim to bring you long-term focused analysis driven by fundamental data. Note that our analysis may not factor in the latest price-sensitive company announcements or qualitative material. Simply Wall St has no position in any stocks mentioned.
New: Manage All Your Stock Portfolios in One Place
We've created the ultimate portfolio companion for stock investors, and it's free.
• Connect an unlimited number of Portfolios and see your total in one currency• Be alerted to new Warning Signs or Risks via email or mobile• Track the Fair Value of your stocks
Try a Demo Portfolio for FreeHave feedback on this article? Concerned about the content? Get in touch with us directly. Alternatively, email editorial-team@simplywallst.com
Disclaimer: Investing carries risk. This is not financial advice. The above content should not be regarded as an offer, recommendation, or solicitation on acquiring or disposing of any financial products, any associated discussions, comments, or posts by author or other users should not be considered as such either. It is solely for general information purpose only, which does not consider your own investment objectives, financial situations or needs. TTM assumes no responsibility or warranty for the accuracy and completeness of the information, investors should do their own research and may seek professional advice before investing.
Most Discussed
- 1
- 2
- 3
- 4
- 5
- 6
- 7
- 8
- 9
- 10