ASX Penny Stock Insights Featuring Duratec And 2 More
The Australian market has seen a mixed performance recently, with sectors like Health Care and Materials showing resilience despite broader challenges in Utilities and Financials. In such fluctuating conditions, identifying stocks with strong financial foundations becomes crucial for investors seeking stability and growth. Penny stocks, while sometimes perceived as outdated, can still offer valuable opportunities when backed by solid fundamentals; this article will explore three such promising candidates on the ASX.
Top 10 Penny Stocks In Australia
| Name | Share Price | Market Cap | Rewards & Risks |
| Alfabs Australia (ASX:AAL) | A$0.43 | A$123.23M | ✅ 3 ⚠️ 3 View Analysis > |
| EZZ Life Science Holdings (ASX:EZZ) | A$2.34 | A$110.39M | ✅ 4 ⚠️ 3 View Analysis > |
| GTN (ASX:GTN) | A$0.39 | A$74.36M | ✅ 4 ⚠️ 2 View Analysis > |
| IVE Group (ASX:IGL) | A$2.97 | A$457.92M | ✅ 4 ⚠️ 2 View Analysis > |
| West African Resources (ASX:WAF) | A$2.70 | A$3.08B | ✅ 5 ⚠️ 1 View Analysis > |
| Regal Partners (ASX:RPL) | A$2.97 | A$998.59M | ✅ 4 ⚠️ 2 View Analysis > |
| Austco Healthcare (ASX:AHC) | A$0.36 | A$131.58M | ✅ 4 ⚠️ 1 View Analysis > |
| Austin Engineering (ASX:ANG) | A$0.31 | A$192.36M | ✅ 4 ⚠️ 1 View Analysis > |
| Bisalloy Steel Group (ASX:BIS) | A$4.54 | A$215.42M | ✅ 3 ⚠️ 1 View Analysis > |
| CTI Logistics (ASX:CLX) | A$1.79 | A$144.17M | ✅ 4 ⚠️ 2 View Analysis > |
Click here to see the full list of 454 stocks from our ASX Penny Stocks screener.
Here's a peek at a few of the choices from the screener.
Duratec (ASX:DUR)
Simply Wall St Financial Health Rating: ★★★★★☆
Overview: Duratec Limited, with a market cap of A$393.17 million, provides assessment, protection, remediation, and refurbishment services for steel and concrete infrastructure assets in Australia.
Operations: Duratec generates revenue from several segments, including Defence (A$193.48 million), Mining & Industrial (A$144.05 million), Buildings & Facades (A$113.64 million), and Energy (A$62.54 million).
Market Cap: A$393.17M
Duratec Limited, with a market cap of A$393.17 million, has demonstrated robust financial health and operational efficiency. The company's debt is well-managed, as cash exceeds total debt and interest payments are covered extensively by EBIT. Despite a recent decline in earnings growth (-6%), Duratec's Return on Equity remains high at 32.9%, supported by stable weekly volatility (5%). Short-term assets surpass liabilities, ensuring liquidity stability. However, profit margins have slightly decreased to 4%, and the dividend track record remains unstable. Trading below estimated fair value presents potential opportunities for investors seeking undervalued stocks in this sector.
- Get an in-depth perspective on Duratec's performance by reading our balance sheet health report here.
- Review our growth performance report to gain insights into Duratec's future.

GR Engineering Services (ASX:GNG)
Simply Wall St Financial Health Rating: ★★★★★★
Overview: GR Engineering Services Limited offers engineering, procurement, and construction services to the mining and mineral processing industries both in Australia and internationally with a market cap of A$718.18 million.
Operations: The company's revenue is derived from two main segments: Mineral Processing, which generated A$412.30 million, and Oil and Gas, contributing A$96.61 million.
Market Cap: A$718.18M
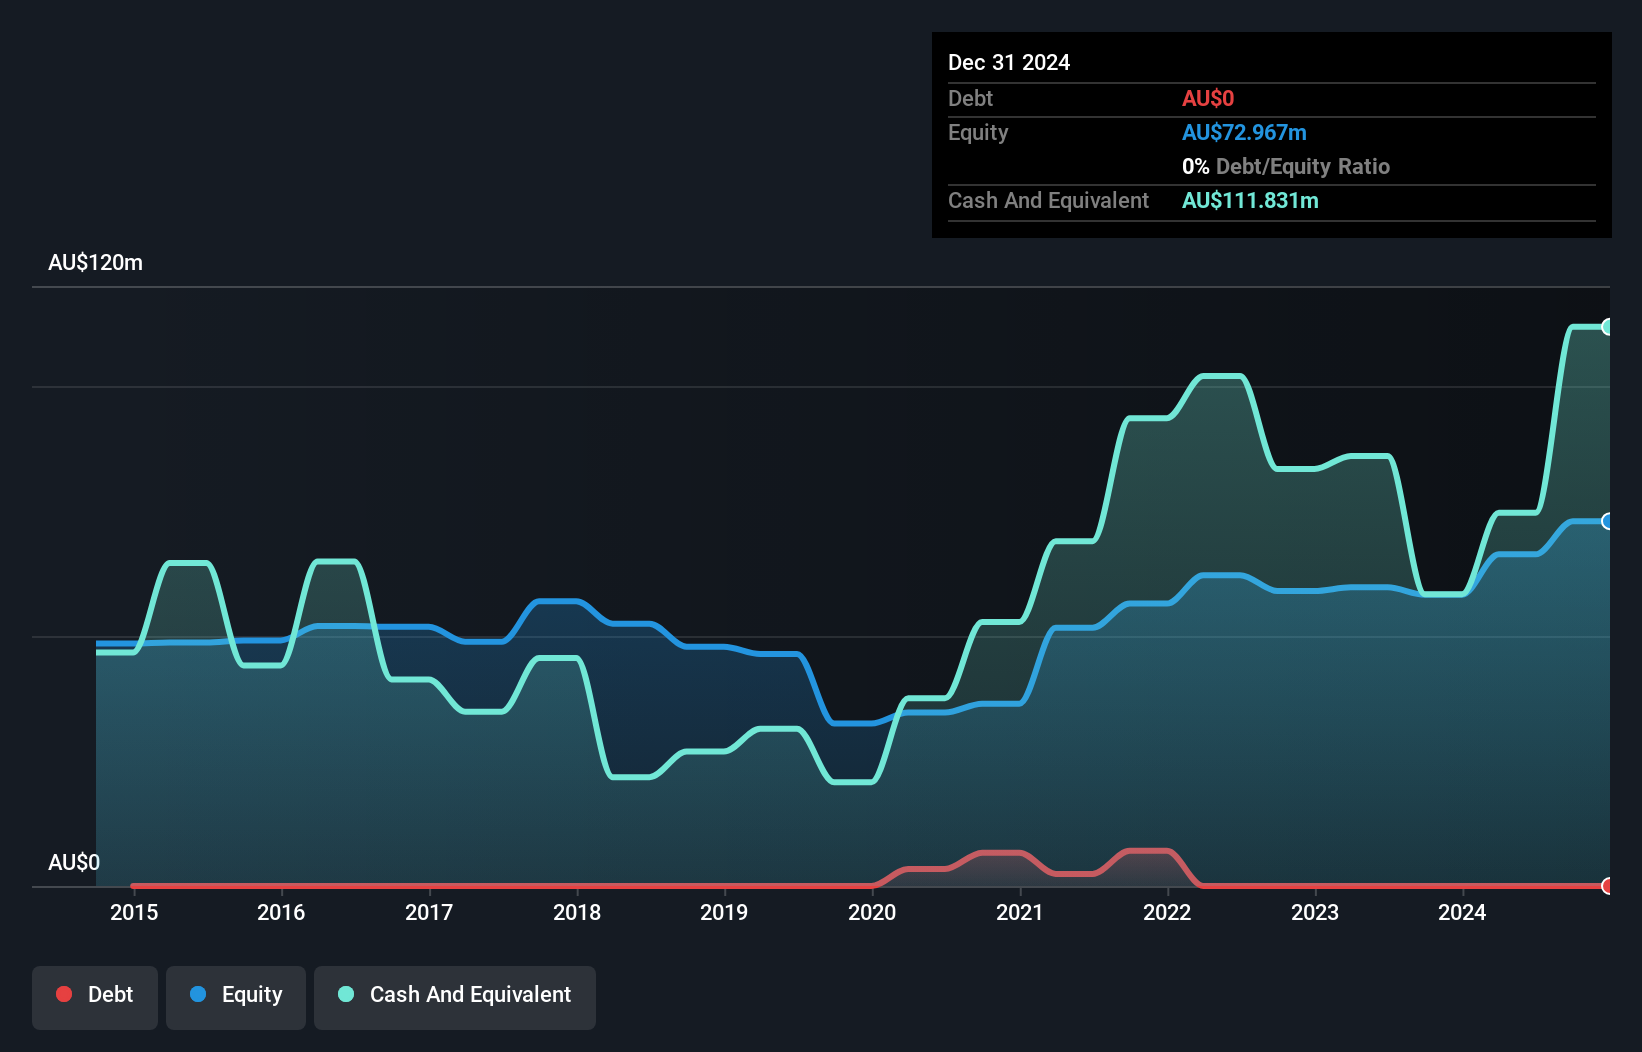
GR Engineering Services Limited, with a market cap of A$718.18 million, showcases strong financial stability and growth potential. The company has no debt, which eliminates concerns over interest payments or cash flow coverage. Its earnings have grown by 34.3% in the past year, outpacing the industry average and exceeding its own five-year growth rate of 33.4%. The management team and board are experienced, contributing to operational effectiveness. GR Engineering's short-term assets comfortably cover both short-term and long-term liabilities, while its return on equity is outstanding at 53%. Trading significantly below estimated fair value may offer investment opportunities for those interested in undervalued stocks within this sector.
- Navigate through the intricacies of GR Engineering Services with our comprehensive balance sheet health report here.
- Explore historical data to track GR Engineering Services' performance over time in our past results report.
Starpharma Holdings (ASX:SPL)
Simply Wall St Financial Health Rating: ★★★★★☆
Overview: Starpharma Holdings Limited is a biopharmaceutical company focused on the research, development, and commercialization of dendrimer products for pharmaceutical and life science applications globally, with a market cap of A$60.64 million.
Operations: The company's revenue is primarily derived from the discovery, development, and commercialization of dendrimers, generating A$4.16 million.
Market Cap: A$60.64M
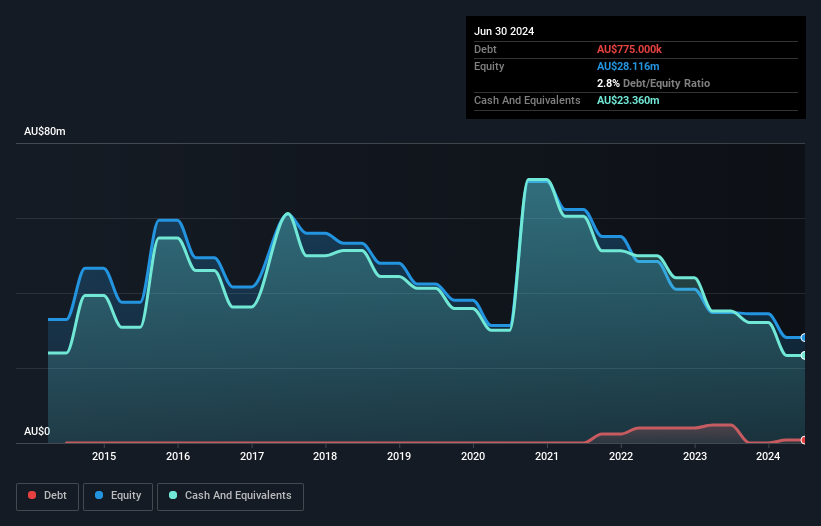
Starpharma Holdings, with a market cap of A$60.64 million, focuses on dendrimer products but remains pre-revenue with only A$4.16 million in revenue. The company is unprofitable but has managed to reduce losses by 9.8% annually over the past five years. It maintains financial stability with more cash than debt and short-term assets covering both short and long-term liabilities. The board's average tenure is 3.7 years, indicating experience, although management tenure data is insufficient for assessment. Recent presentations at international conferences highlight ongoing efforts to engage with the scientific community and potential investors globally.
- Click here and access our complete financial health analysis report to understand the dynamics of Starpharma Holdings.
- Understand Starpharma Holdings' track record by examining our performance history report.
Taking Advantage
- Dive into all 454 of the ASX Penny Stocks we have identified here.
- Searching for a Fresh Perspective? We've found 19 US stocks that are forecast to pay a dividend yeild of over 6% next year. See the full list for free.
This article by Simply Wall St is general in nature. We provide commentary based on historical data and analyst forecasts only using an unbiased methodology and our articles are not intended to be financial advice. It does not constitute a recommendation to buy or sell any stock, and does not take account of your objectives, or your financial situation. We aim to bring you long-term focused analysis driven by fundamental data. Note that our analysis may not factor in the latest price-sensitive company announcements or qualitative material. Simply Wall St has no position in any stocks mentioned.
New: Manage All Your Stock Portfolios in One Place
We've created the ultimate portfolio companion for stock investors, and it's free.
• Connect an unlimited number of Portfolios and see your total in one currency• Be alerted to new Warning Signs or Risks via email or mobile• Track the Fair Value of your stocks
Try a Demo Portfolio for FreeHave feedback on this article? Concerned about the content? Get in touch with us directly. Alternatively, email editorial-team@simplywallst.com
Disclaimer: Investing carries risk. This is not financial advice. The above content should not be regarded as an offer, recommendation, or solicitation on acquiring or disposing of any financial products, any associated discussions, comments, or posts by author or other users should not be considered as such either. It is solely for general information purpose only, which does not consider your own investment objectives, financial situations or needs. TTM assumes no responsibility or warranty for the accuracy and completeness of the information, investors should do their own research and may seek professional advice before investing.
Most Discussed
- 1
- 2
- 3
- 4
- 5
- 6
- 7
- 8
- 9
- 10