Vibrant Group Limited's (SGX:BIP) Shares Climb 47% But Its Business Is Yet to Catch Up
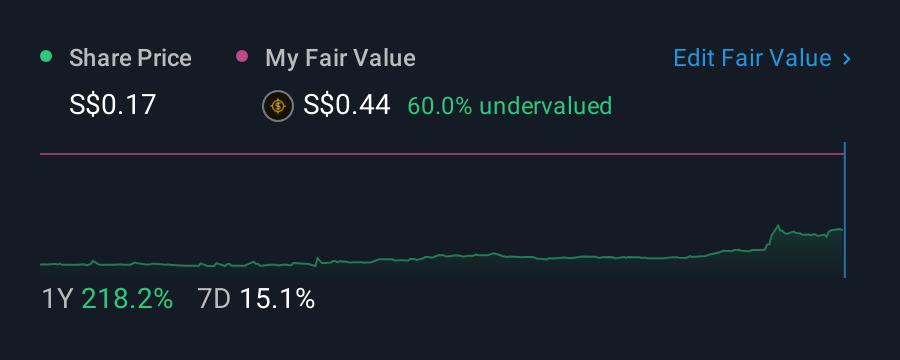
Vibrant Group Limited (SGX:BIP) shares have continued their recent momentum with a 47% gain in the last month alone. The last month tops off a massive increase of 141% in the last year.
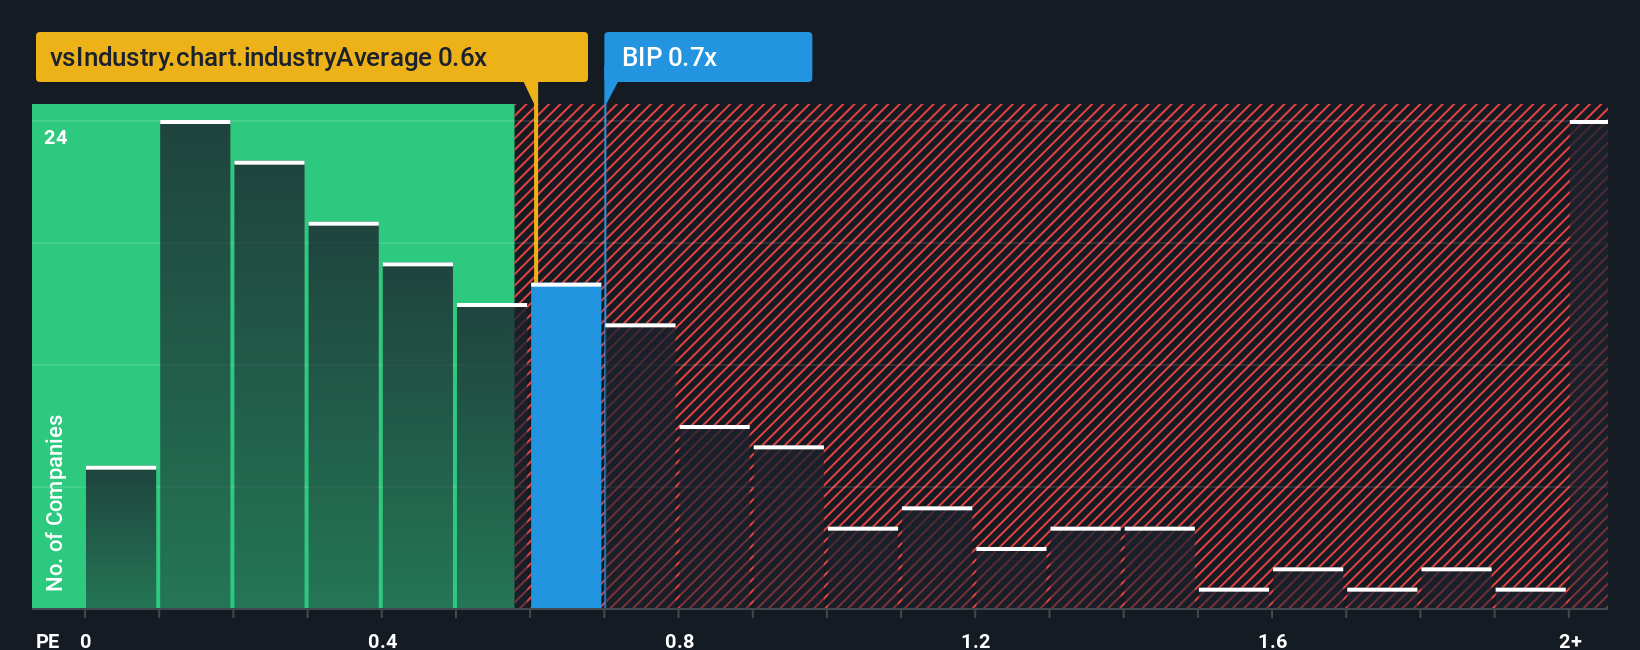
In spite of the firm bounce in price, it's still not a stretch to say that Vibrant Group's price-to-sales (or "P/S") ratio of 0.7x right now seems quite "middle-of-the-road" compared to the Logistics industry in Singapore, where the median P/S ratio is around 0.8x. However, investors might be overlooking a clear opportunity or potential setback if there is no rational basis for the P/S.
This technology could replace computers: discover the 20 stocks are working to make quantum computing a reality.
Check out our latest analysis for Vibrant Group
How Vibrant Group Has Been Performing
The revenue growth achieved at Vibrant Group over the last year would be more than acceptable for most companies. Perhaps the market is expecting future revenue performance to only keep up with the broader industry, which has keeping the P/S in line with expectations. If that doesn't eventuate, then existing shareholders probably aren't too pessimistic about the future direction of the share price.
Although there are no analyst estimates available for Vibrant Group, take a look at this free data-rich visualisation to see how the company stacks up on earnings, revenue and cash flow.Is There Some Revenue Growth Forecasted For Vibrant Group?
In order to justify its P/S ratio, Vibrant Group would need to produce growth that's similar to the industry.
If we review the last year of revenue growth, the company posted a worthy increase of 7.9%. Still, lamentably revenue has fallen 26% in aggregate from three years ago, which is disappointing. Accordingly, shareholders would have felt downbeat about the medium-term rates of revenue growth.
Weighing that medium-term revenue trajectory against the broader industry's one-year forecast for expansion of 9.5% shows it's an unpleasant look.
In light of this, it's somewhat alarming that Vibrant Group's P/S sits in line with the majority of other companies. Apparently many investors in the company are way less bearish than recent times would indicate and aren't willing to let go of their stock right now. There's a good chance existing shareholders are setting themselves up for future disappointment if the P/S falls to levels more in line with the recent negative growth rates.
The Bottom Line On Vibrant Group's P/S
Vibrant Group appears to be back in favour with a solid price jump bringing its P/S back in line with other companies in the industry Typically, we'd caution against reading too much into price-to-sales ratios when settling on investment decisions, though it can reveal plenty about what other market participants think about the company.
Our look at Vibrant Group revealed its shrinking revenues over the medium-term haven't impacted the P/S as much as we anticipated, given the industry is set to grow. Even though it matches the industry, we're uncomfortable with the current P/S ratio, as this dismal revenue performance is unlikely to support a more positive sentiment for long. If recent medium-term revenue trends continue, it will place shareholders' investments at risk and potential investors in danger of paying an unnecessary premium.
Don't forget that there may be other risks. For instance, we've identified 3 warning signs for Vibrant Group that you should be aware of.
If strong companies turning a profit tickle your fancy, then you'll want to check out this free list of interesting companies that trade on a low P/E (but have proven they can grow earnings).
New: Manage All Your Stock Portfolios in One Place
We've created the ultimate portfolio companion for stock investors, and it's free.
• Connect an unlimited number of Portfolios and see your total in one currency• Be alerted to new Warning Signs or Risks via email or mobile• Track the Fair Value of your stocks
Try a Demo Portfolio for FreeHave feedback on this article? Concerned about the content? Get in touch with us directly. Alternatively, email editorial-team (at) simplywallst.com.This article by Simply Wall St is general in nature. We provide commentary based on historical data and analyst forecasts only using an unbiased methodology and our articles are not intended to be financial advice. It does not constitute a recommendation to buy or sell any stock, and does not take account of your objectives, or your financial situation. We aim to bring you long-term focused analysis driven by fundamental data. Note that our analysis may not factor in the latest price-sensitive company announcements or qualitative material. Simply Wall St has no position in any stocks mentioned.
Disclaimer: Investing carries risk. This is not financial advice. The above content should not be regarded as an offer, recommendation, or solicitation on acquiring or disposing of any financial products, any associated discussions, comments, or posts by author or other users should not be considered as such either. It is solely for general information purpose only, which does not consider your own investment objectives, financial situations or needs. TTM assumes no responsibility or warranty for the accuracy and completeness of the information, investors should do their own research and may seek professional advice before investing.
Most Discussed
- 1
- 2
- 3
- 4
- 5
- 6
- 7
- 8
- 9
- 10