After Leaping 117% AJ Lucas Group Limited (ASX:AJL) Shares Are Not Flying Under The Radar
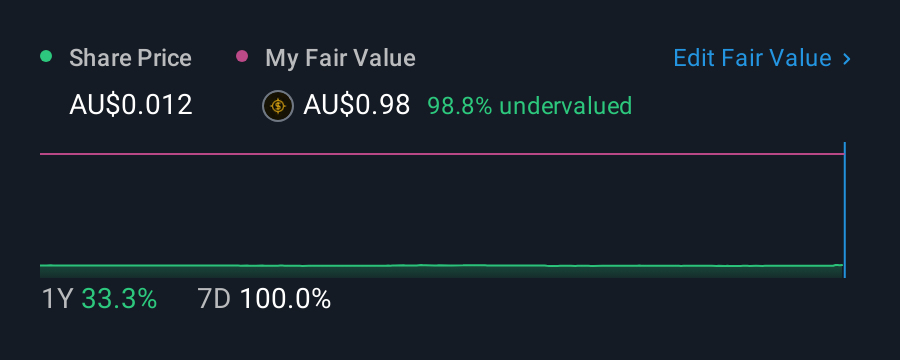
AJ Lucas Group Limited (ASX:AJL) shareholders have had their patience rewarded with a 117% share price jump in the last month. The last 30 days bring the annual gain to a very sharp 44%.
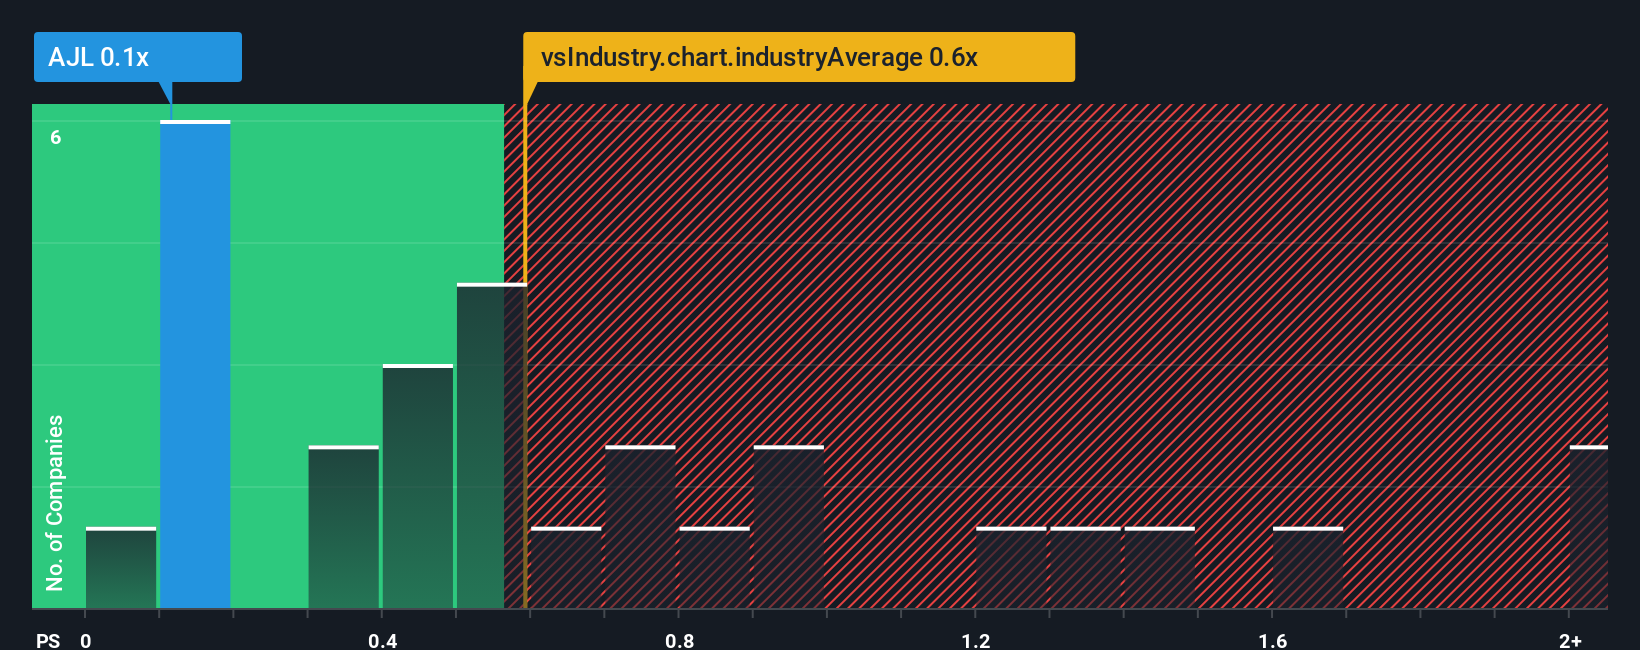
Although its price has surged higher, there still wouldn't be many who think AJ Lucas Group's price-to-sales (or "P/S") ratio of 0.1x is worth a mention when the median P/S in Australia's Construction industry is similar at about 0.6x. Although, it's not wise to simply ignore the P/S without explanation as investors may be disregarding a distinct opportunity or a costly mistake.
AI is about to change healthcare. These 20 stocks are working on everything from early diagnostics to drug discovery. The best part - they are all under $10bn in marketcap - there is still time to get in early.
Check out our latest analysis for AJ Lucas Group
How Has AJ Lucas Group Performed Recently?
AJ Lucas Group has been doing a decent job lately as it's been growing revenue at a reasonable pace. It might be that many expect the respectable revenue performance to only match most other companies over the coming period, which has kept the P/S from rising. Those who are bullish on AJ Lucas Group will be hoping that this isn't the case, so that they can pick up the stock at a lower valuation.
Although there are no analyst estimates available for AJ Lucas Group, take a look at this free data-rich visualisation to see how the company stacks up on earnings, revenue and cash flow.Is There Some Revenue Growth Forecasted For AJ Lucas Group?
AJ Lucas Group's P/S ratio would be typical for a company that's only expected to deliver moderate growth, and importantly, perform in line with the industry.
Taking a look back first, we see that the company managed to grow revenues by a handy 3.3% last year. Pleasingly, revenue has also lifted 43% in aggregate from three years ago, partly thanks to the last 12 months of growth. Therefore, it's fair to say the revenue growth recently has been superb for the company.
It's interesting to note that the rest of the industry is similarly expected to grow by 12% over the next year, which is fairly even with the company's recent medium-term annualised growth rates.
With this in consideration, it's clear to see why AJ Lucas Group's P/S matches up closely to its industry peers. Apparently shareholders are comfortable to simply hold on assuming the company will continue keeping a low profile.
The Key Takeaway
Its shares have lifted substantially and now AJ Lucas Group's P/S is back within range of the industry median. We'd say the price-to-sales ratio's power isn't primarily as a valuation instrument but rather to gauge current investor sentiment and future expectations.
It appears to us that AJ Lucas Group maintains its moderate P/S off the back of its recent three-year growth being in line with the wider industry forecast. With previous revenue trends that keep up with the current industry outlook, it's hard to justify the company's P/S ratio deviating much from it's current point. Unless the recent medium-term conditions change, they will continue to support the share price at these levels.
There are also other vital risk factors to consider and we've discovered 4 warning signs for AJ Lucas Group (3 are significant!) that you should be aware of before investing here.
If these risks are making you reconsider your opinion on AJ Lucas Group, explore our interactive list of high quality stocks to get an idea of what else is out there.
New: Manage All Your Stock Portfolios in One Place
We've created the ultimate portfolio companion for stock investors, and it's free.
• Connect an unlimited number of Portfolios and see your total in one currency• Be alerted to new Warning Signs or Risks via email or mobile• Track the Fair Value of your stocks
Try a Demo Portfolio for FreeHave feedback on this article? Concerned about the content? Get in touch with us directly. Alternatively, email editorial-team (at) simplywallst.com.This article by Simply Wall St is general in nature. We provide commentary based on historical data and analyst forecasts only using an unbiased methodology and our articles are not intended to be financial advice. It does not constitute a recommendation to buy or sell any stock, and does not take account of your objectives, or your financial situation. We aim to bring you long-term focused analysis driven by fundamental data. Note that our analysis may not factor in the latest price-sensitive company announcements or qualitative material. Simply Wall St has no position in any stocks mentioned.
Disclaimer: Investing carries risk. This is not financial advice. The above content should not be regarded as an offer, recommendation, or solicitation on acquiring or disposing of any financial products, any associated discussions, comments, or posts by author or other users should not be considered as such either. It is solely for general information purpose only, which does not consider your own investment objectives, financial situations or needs. TTM assumes no responsibility or warranty for the accuracy and completeness of the information, investors should do their own research and may seek professional advice before investing.
Most Discussed
- 1
- 2
- 3
- 4
- 5
- 6
- 7
- 8
- 9
- 10