Wellard (ASX:WLD) Shareholders Will Want The ROCE Trajectory To Continue
What are the early trends we should look for to identify a stock that could multiply in value over the long term? Ideally, a business will show two trends; firstly a growing return on capital employed (ROCE) and secondly, an increasing amount of capital employed. If you see this, it typically means it's a company with a great business model and plenty of profitable reinvestment opportunities. So when we looked at Wellard (ASX:WLD) and its trend of ROCE, we really liked what we saw.
We've found 21 US stocks that are forecast to pay a dividend yield of over 6% next year. See the full list for free.
What Is Return On Capital Employed (ROCE)?
For those who don't know, ROCE is a measure of a company's yearly pre-tax profit (its return), relative to the capital employed in the business. To calculate this metric for Wellard, this is the formula:
Return on Capital Employed = Earnings Before Interest and Tax (EBIT) ÷ (Total Assets - Current Liabilities)
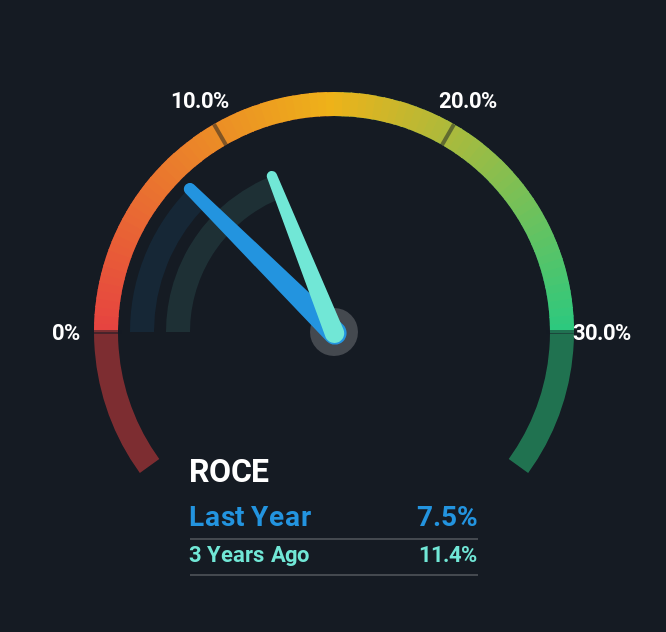
0.075 = US$2.1m ÷ (US$33m - US$4.6m) (Based on the trailing twelve months to December 2024).
So, Wellard has an ROCE of 7.5%. In absolute terms, that's a low return but it's around the Food industry average of 9.0%.
Check out our latest analysis for Wellard
While the past is not representative of the future, it can be helpful to know how a company has performed historically, which is why we have this chart above. If you're interested in investigating Wellard's past further, check out this free graph covering Wellard's past earnings, revenue and cash flow.
How Are Returns Trending?
Like most people, we're pleased that Wellard is now generating some pretax earnings. The company was generating losses five years ago, but now it's turned around, earning 7.5% which is no doubt a relief for some early shareholders. At first glance, it seems the business is getting more proficient at generating returns, because over the same period, the amount of capital employed has reduced by 30%. This could potentially mean that the company is selling some of its assets.
In another part of our analysis, we noticed that the company's ratio of current liabilities to total assets decreased to 14%, which broadly means the business is relying less on its suppliers or short-term creditors to fund its operations. This tells us that Wellard has grown its returns without a reliance on increasing their current liabilities, which we're very happy with.
In Conclusion...
In the end, Wellard has proven it's capital allocation skills are good with those higher returns from less amount of capital. And with the stock having performed exceptionally well over the last five years, these patterns are being accounted for by investors. Therefore, we think it would be worth your time to check if these trends are going to continue.
Wellard does have some risks, we noticed 2 warning signs (and 1 which makes us a bit uncomfortable) we think you should know about.
If you want to search for solid companies with great earnings, check out this free list of companies with good balance sheets and impressive returns on equity.
Valuation is complex, but we're here to simplify it.
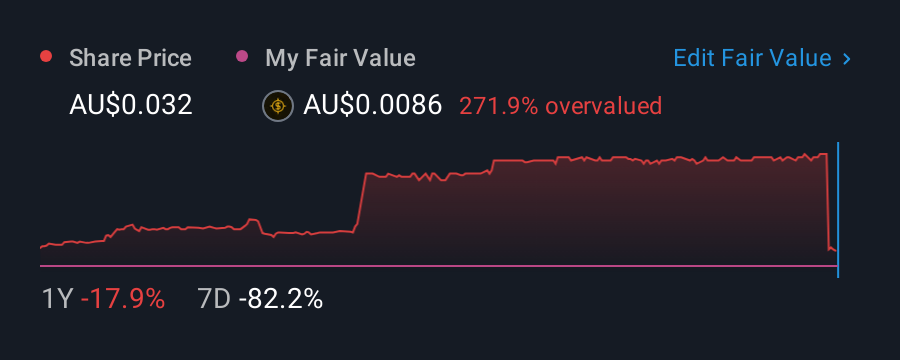
Discover if Wellard might be undervalued or overvalued with our detailed analysis, featuring fair value estimates, potential risks, dividends, insider trades, and its financial condition.
Access Free AnalysisHave feedback on this article? Concerned about the content? Get in touch with us directly. Alternatively, email editorial-team (at) simplywallst.com.This article by Simply Wall St is general in nature. We provide commentary based on historical data and analyst forecasts only using an unbiased methodology and our articles are not intended to be financial advice. It does not constitute a recommendation to buy or sell any stock, and does not take account of your objectives, or your financial situation. We aim to bring you long-term focused analysis driven by fundamental data. Note that our analysis may not factor in the latest price-sensitive company announcements or qualitative material. Simply Wall St has no position in any stocks mentioned.
Disclaimer: Investing carries risk. This is not financial advice. The above content should not be regarded as an offer, recommendation, or solicitation on acquiring or disposing of any financial products, any associated discussions, comments, or posts by author or other users should not be considered as such either. It is solely for general information purpose only, which does not consider your own investment objectives, financial situations or needs. TTM assumes no responsibility or warranty for the accuracy and completeness of the information, investors should do their own research and may seek professional advice before investing.
Most Discussed
- 1
- 2
- 3
- 4
- 5
- 6
- 7
- 8
- 9
- 10