Healius (ASX:HLS) adds AU$65m to market cap in the past 7 days, though investors from three years ago are still down 66%
Healius Limited (ASX:HLS) shareholders should be happy to see the share price up 14% in the last month. But over the last three years we've seen a quite serious decline. Tragically, the share price declined 77% in that time. Some might say the recent bounce is to be expected after such a bad drop. The rise has some hopeful, but turnarounds are often precarious.
While the last three years has been tough for Healius shareholders, this past week has shown signs of promise. So let's look at the longer term fundamentals and see if they've been the driver of the negative returns.
We've found 21 US stocks that are forecast to pay a dividend yield of over 6% next year. See the full list for free.
Because Healius made a loss in the last twelve months, we think the market is probably more focussed on revenue and revenue growth, at least for now. Shareholders of unprofitable companies usually desire strong revenue growth. As you can imagine, fast revenue growth, when maintained, often leads to fast profit growth.
In the last three years Healius saw its revenue shrink by 11% per year. That's not what investors generally want to see. The share price fall of 21% (per year, over three years) is a stern reminder that money-losing companies are expected to grow revenue. We're generally averse to companies with declining revenues, but we're not alone in that. Don't let a share price decline ruin your calm. You make better decisions when you're calm.
You can see below how earnings and revenue have changed over time (discover the exact values by clicking on the image).
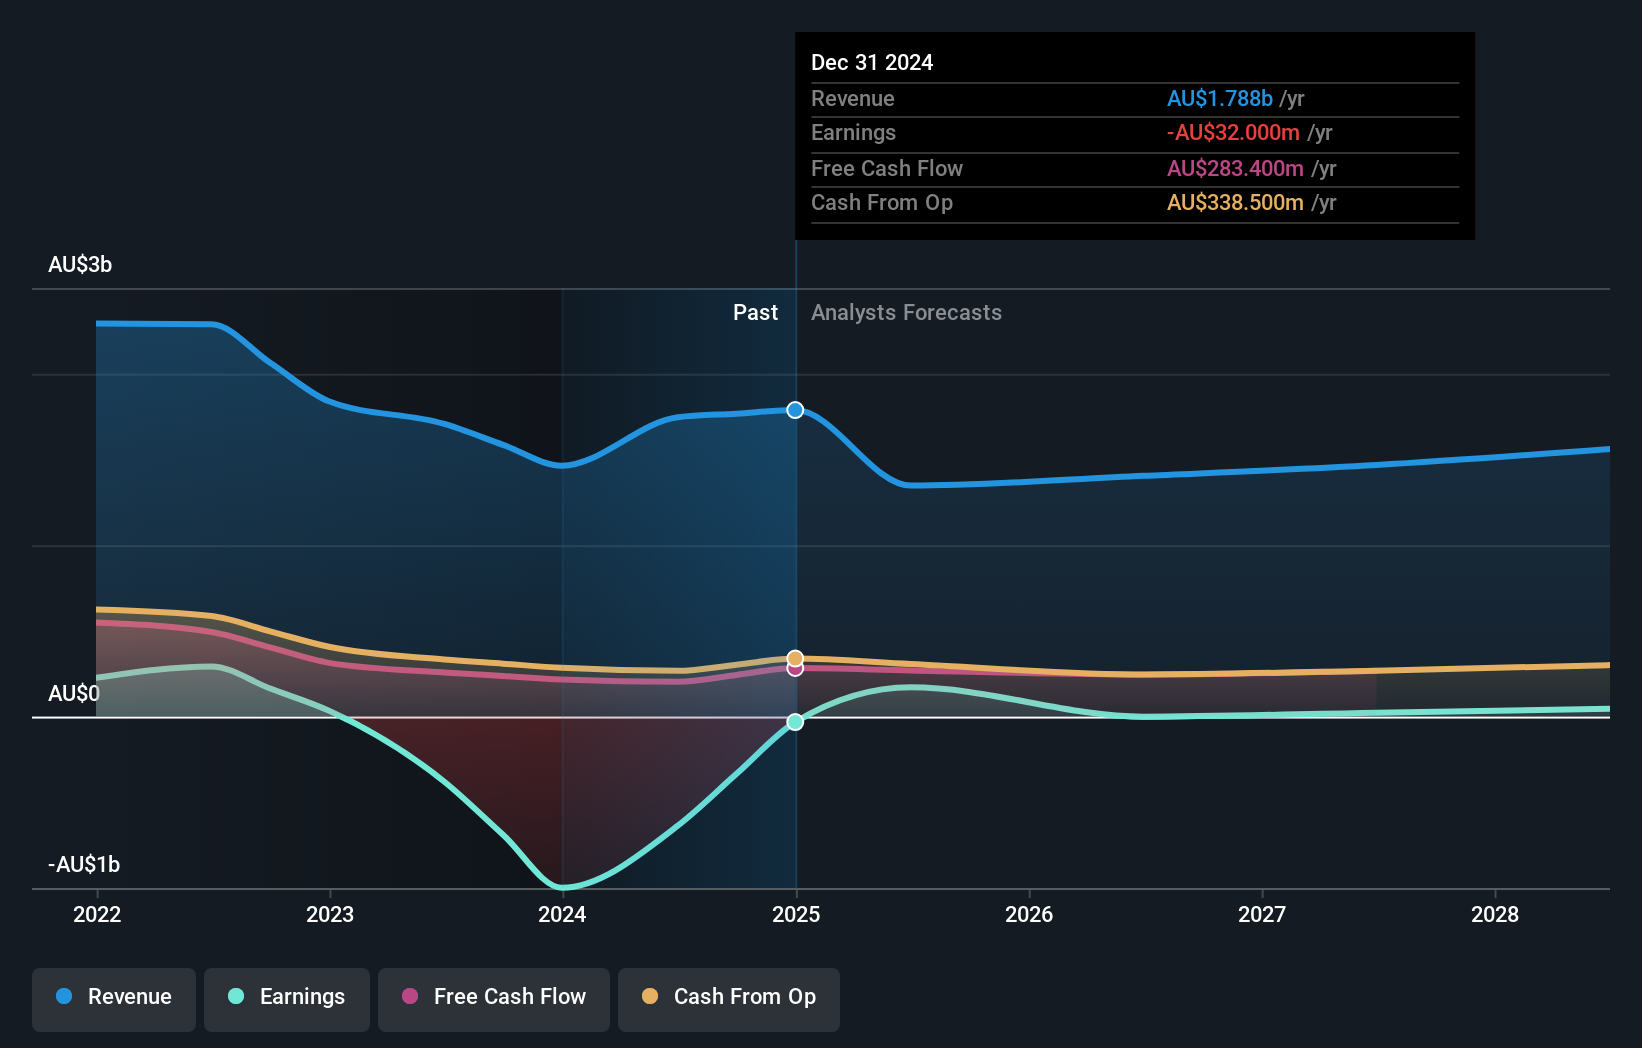
We consider it positive that insiders have made significant purchases in the last year. Even so, future earnings will be far more important to whether current shareholders make money. You can see what analysts are predicting for Healius in this interactive graph of future profit estimates.
What About The Total Shareholder Return (TSR)?
We'd be remiss not to mention the difference between Healius' total shareholder return (TSR) and its share price return. Arguably the TSR is a more complete return calculation because it accounts for the value of dividends (as if they were reinvested), along with the hypothetical value of any discounted capital that have been offered to shareholders. Dividends have been really beneficial for Healius shareholders, and that cash payout explains why its total shareholder loss of 66%, over the last 3 years, isn't as bad as the share price return.
A Different Perspective
Investors in Healius had a tough year, with a total loss of 18%, against a market gain of about 20%. However, keep in mind that even the best stocks will sometimes underperform the market over a twelve month period. Unfortunately, last year's performance may indicate unresolved challenges, given that it was worse than the annualised loss of 10% over the last half decade. Generally speaking long term share price weakness can be a bad sign, though contrarian investors might want to research the stock in hope of a turnaround. If you want to research this stock further, the data on insider buying is an obvious place to start. You can click here to see who has been buying shares - and the price they paid.
If you like to buy stocks alongside management, then you might just love this free list of companies. (Hint: most of them are flying under the radar).
Please note, the market returns quoted in this article reflect the market weighted average returns of stocks that currently trade on Australian exchanges.
Valuation is complex, but we're here to simplify it.
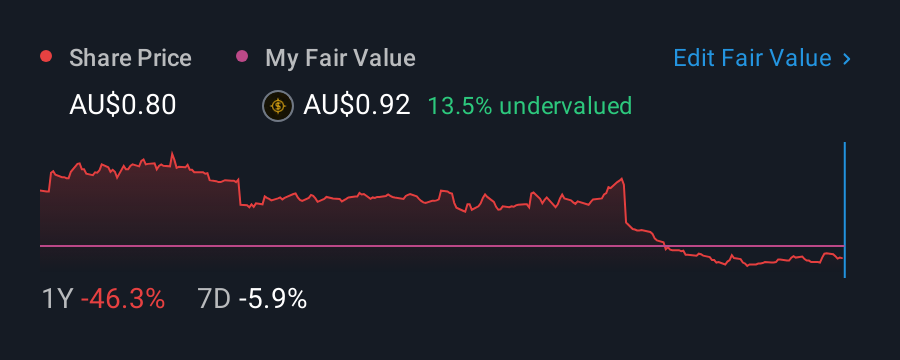
Discover if Healius might be undervalued or overvalued with our detailed analysis, featuring fair value estimates, potential risks, dividends, insider trades, and its financial condition.
Access Free AnalysisHave feedback on this article? Concerned about the content? Get in touch with us directly. Alternatively, email editorial-team (at) simplywallst.com.This article by Simply Wall St is general in nature. We provide commentary based on historical data and analyst forecasts only using an unbiased methodology and our articles are not intended to be financial advice. It does not constitute a recommendation to buy or sell any stock, and does not take account of your objectives, or your financial situation. We aim to bring you long-term focused analysis driven by fundamental data. Note that our analysis may not factor in the latest price-sensitive company announcements or qualitative material. Simply Wall St has no position in any stocks mentioned.
Disclaimer: Investing carries risk. This is not financial advice. The above content should not be regarded as an offer, recommendation, or solicitation on acquiring or disposing of any financial products, any associated discussions, comments, or posts by author or other users should not be considered as such either. It is solely for general information purpose only, which does not consider your own investment objectives, financial situations or needs. TTM assumes no responsibility or warranty for the accuracy and completeness of the information, investors should do their own research and may seek professional advice before investing.
Most Discussed
- 1
- 2
- 3
- 4
- 5
- 6
- 7
- 8
- 9
- 10