Here's Why We're Watching Starpharma Holdings' (ASX:SPL) Cash Burn Situation
We can readily understand why investors are attracted to unprofitable companies. For example, although software-as-a-service business Salesforce.com lost money for years while it grew recurring revenue, if you held shares since 2005, you'd have done very well indeed. Having said that, unprofitable companies are risky because they could potentially burn through all their cash and become distressed.
So should Starpharma Holdings (ASX:SPL) shareholders be worried about its cash burn? For the purpose of this article, we'll define cash burn as the amount of cash the company is spending each year to fund its growth (also called its negative free cash flow). First, we'll determine its cash runway by comparing its cash burn with its cash reserves.
Trump has pledged to "unleash" American oil and gas and these 15 US stocks have developments that are poised to benefit.
Does Starpharma Holdings Have A Long Cash Runway?
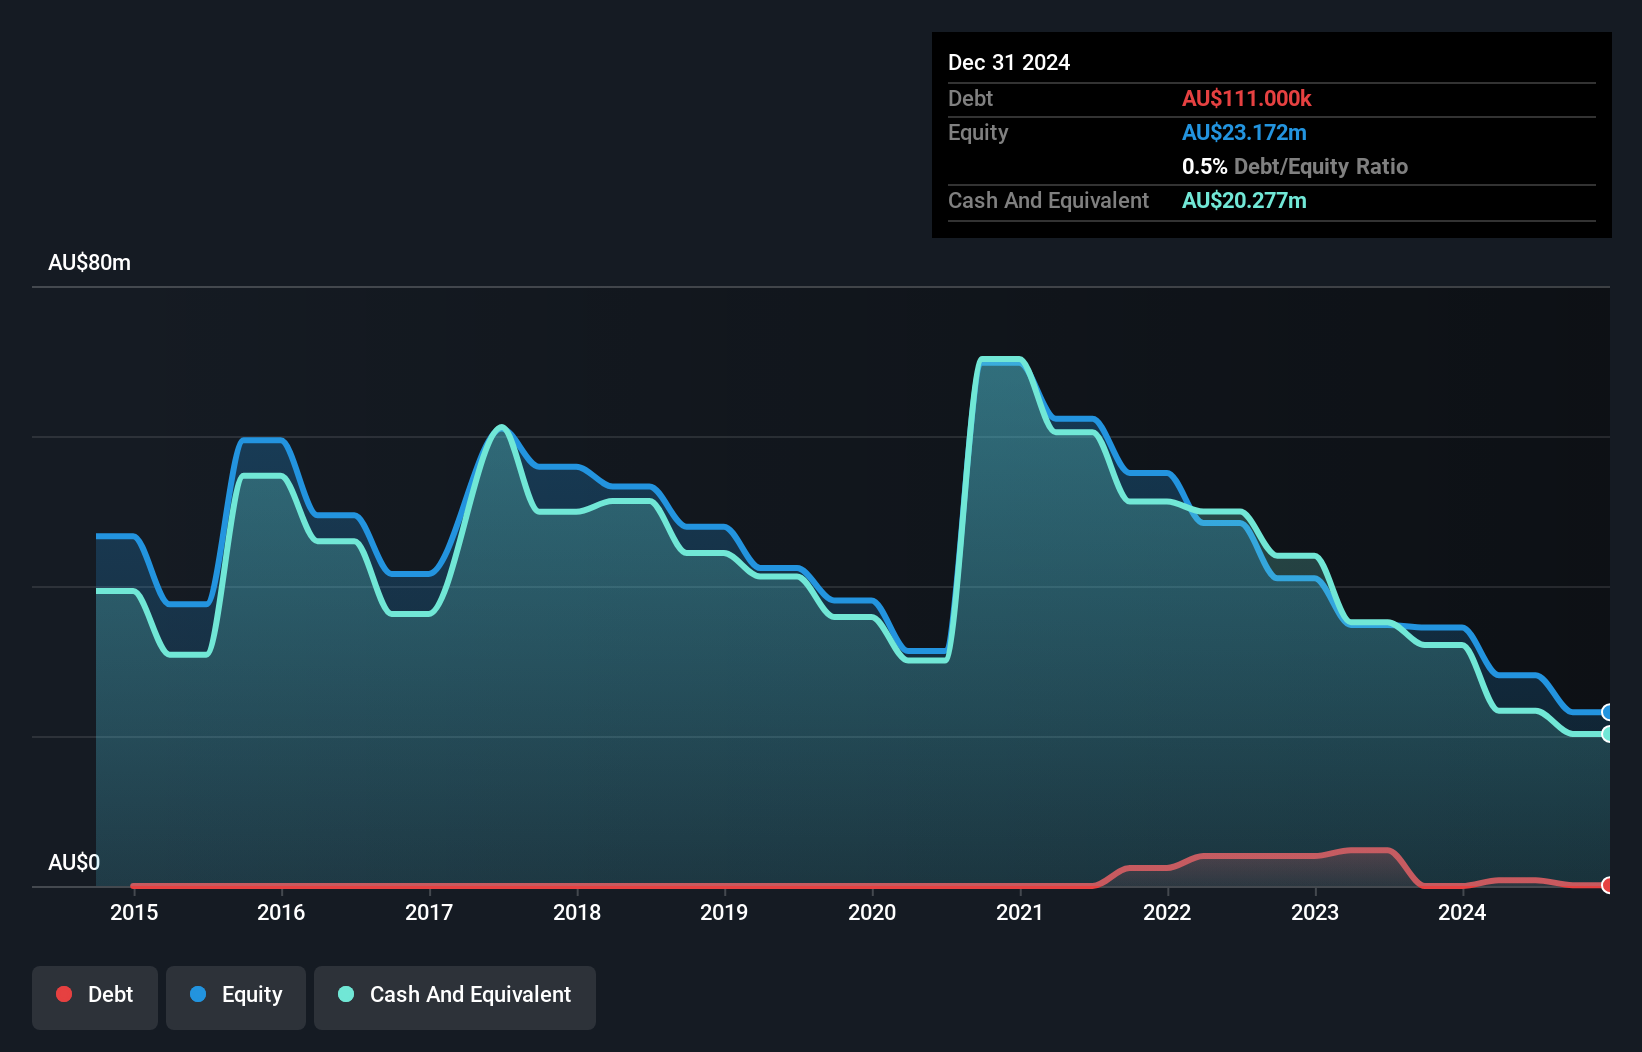
A company's cash runway is calculated by dividing its cash hoard by its cash burn. Starpharma Holdings has such a small amount of debt that we'll set it aside, and focus on the AU$20m in cash it held at December 2024. Importantly, its cash burn was AU$11m over the trailing twelve months. Therefore, from December 2024 it had roughly 22 months of cash runway. That's not too bad, but it's fair to say the end of the cash runway is in sight, unless cash burn reduces drastically. Depicted below, you can see how its cash holdings have changed over time.
See our latest analysis for Starpharma Holdings
How Well Is Starpharma Holdings Growing?
Starpharma Holdings actually ramped up its cash burn by a whopping 53% in the last year, which shows it is boosting investment in the business. And that is all the more of a concern in light of the fact that operating revenue was actually down by 61% in the last year, as the company no doubt scrambles to change its fortunes. Considering these two factors together makes us nervous about the direction the company seems to be heading. Of course, we've only taken a quick look at the stock's growth metrics, here. You can take a look at how Starpharma Holdings has developed its business over time by checking this visualization of its revenue and earnings history.
Can Starpharma Holdings Raise More Cash Easily?
Since Starpharma Holdings can't yet boast improving growth metrics, the market will likely be considering how it can raise more cash if need be. Generally speaking, a listed business can raise new cash through issuing shares or taking on debt. Commonly, a business will sell new shares in itself to raise cash and drive growth. By comparing a company's annual cash burn to its total market capitalisation, we can estimate roughly how many shares it would have to issue in order to run the company for another year (at the same burn rate).
Starpharma Holdings' cash burn of AU$11m is about 24% of its AU$46m market capitalisation. That's fairly notable cash burn, so if the company had to sell shares to cover the cost of another year's operations, shareholders would suffer some costly dilution.
How Risky Is Starpharma Holdings' Cash Burn Situation?
On this analysis of Starpharma Holdings' cash burn, we think its cash runway was reassuring, while its falling revenue has us a bit worried. Looking at the factors mentioned in this short report, we do think that its cash burn is a bit risky, and it does make us slightly nervous about the stock. Readers need to have a sound understanding of business risks before investing in a stock, and we've spotted 2 warning signs for Starpharma Holdings that potential shareholders should take into account before putting money into a stock.
Of course, you might find a fantastic investment by looking elsewhere. So take a peek at this free list of interesting companies, and this list of stocks growth stocks (according to analyst forecasts)
New: Manage All Your Stock Portfolios in One Place
We've created the ultimate portfolio companion for stock investors, and it's free.
• Connect an unlimited number of Portfolios and see your total in one currency• Be alerted to new Warning Signs or Risks via email or mobile• Track the Fair Value of your stocks
Try a Demo Portfolio for FreeHave feedback on this article? Concerned about the content? Get in touch with us directly. Alternatively, email editorial-team (at) simplywallst.com.This article by Simply Wall St is general in nature. We provide commentary based on historical data and analyst forecasts only using an unbiased methodology and our articles are not intended to be financial advice. It does not constitute a recommendation to buy or sell any stock, and does not take account of your objectives, or your financial situation. We aim to bring you long-term focused analysis driven by fundamental data. Note that our analysis may not factor in the latest price-sensitive company announcements or qualitative material. Simply Wall St has no position in any stocks mentioned.
Disclaimer: Investing carries risk. This is not financial advice. The above content should not be regarded as an offer, recommendation, or solicitation on acquiring or disposing of any financial products, any associated discussions, comments, or posts by author or other users should not be considered as such either. It is solely for general information purpose only, which does not consider your own investment objectives, financial situations or needs. TTM assumes no responsibility or warranty for the accuracy and completeness of the information, investors should do their own research and may seek professional advice before investing.
Most Discussed
- 1
- 2
- 3
- 4
- 5
- 6
- 7
- 8
- 9
- 10