NIU Holdings Limited's (HKG:8619) P/S Is Still On The Mark Following 38% Share Price Bounce
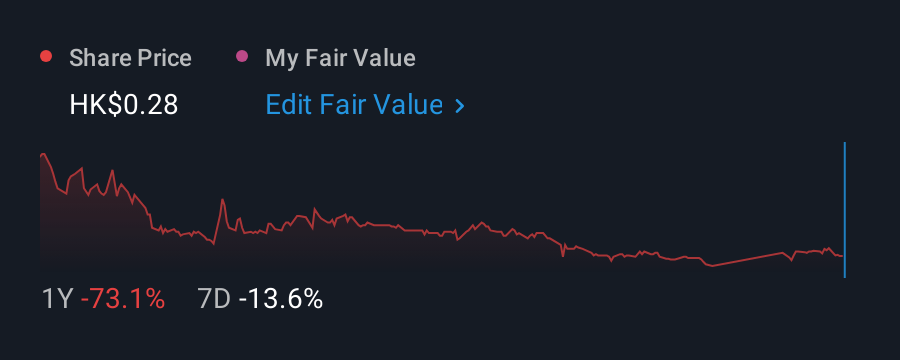
Those holding NIU Holdings Limited (HKG:8619) shares would be relieved that the share price has rebounded 38% in the last thirty days, but it needs to keep going to repair the recent damage it has caused to investor portfolios. Still, the 30-day jump doesn't change the fact that longer term shareholders have seen their stock decimated by the 83% share price drop in the last twelve months.
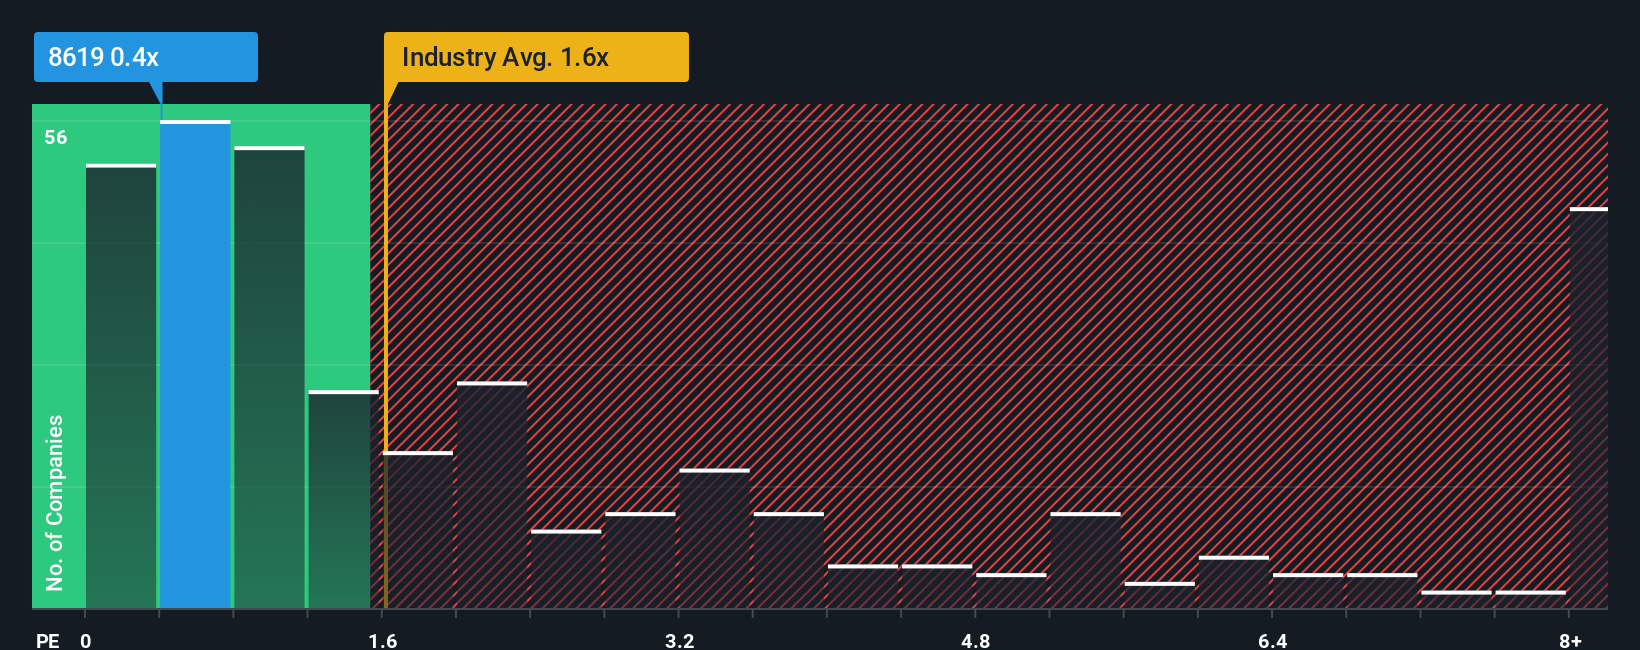
Even after such a large jump in price, you could still be forgiven for feeling indifferent about NIU Holdings' P/S ratio of 0.4x, since the median price-to-sales (or "P/S") ratio for the Professional Services industry in Hong Kong is about the same. However, investors might be overlooking a clear opportunity or potential setback if there is no rational basis for the P/S.
This technology could replace computers: discover the 20 stocks are working to make quantum computing a reality.
View our latest analysis for NIU Holdings
How Has NIU Holdings Performed Recently?
NIU Holdings has been doing a decent job lately as it's been growing revenue at a reasonable pace. One possibility is that the P/S is moderate because investors think this good revenue growth might only be parallel to the broader industry in the near future. If not, then at least existing shareholders probably aren't too pessimistic about the future direction of the share price.
Want the full picture on earnings, revenue and cash flow for the company? Then our free report on NIU Holdings will help you shine a light on its historical performance.How Is NIU Holdings' Revenue Growth Trending?
The only time you'd be comfortable seeing a P/S like NIU Holdings' is when the company's growth is tracking the industry closely.
Taking a look back first, we see that the company managed to grow revenues by a handy 3.3% last year. This was backed up an excellent period prior to see revenue up by 32% in total over the last three years. Therefore, it's fair to say the revenue growth recently has been superb for the company.
Weighing that recent medium-term revenue trajectory against the broader industry's one-year forecast for expansion of 8.4% shows it's about the same on an annualised basis.
With this in consideration, it's clear to see why NIU Holdings' P/S matches up closely to its industry peers. Apparently shareholders are comfortable to simply hold on assuming the company will continue keeping a low profile.
What Does NIU Holdings' P/S Mean For Investors?
Its shares have lifted substantially and now NIU Holdings' P/S is back within range of the industry median. It's argued the price-to-sales ratio is an inferior measure of value within certain industries, but it can be a powerful business sentiment indicator.
As we've seen, NIU Holdings' three-year revenue trends seem to be contributing to its P/S, given they look similar to current industry expectations. Right now shareholders are comfortable with the P/S as they are quite confident future revenue won't throw up any surprises. If recent medium-term revenue trends continue, it's hard to see the share price moving strongly in either direction in the near future under these circumstances.
You should always think about risks. Case in point, we've spotted 3 warning signs for NIU Holdings you should be aware of.
If strong companies turning a profit tickle your fancy, then you'll want to check out this free list of interesting companies that trade on a low P/E (but have proven they can grow earnings).
Valuation is complex, but we're here to simplify it.
Discover if NIU Holdings might be undervalued or overvalued with our detailed analysis, featuring fair value estimates, potential risks, dividends, insider trades, and its financial condition.
Access Free AnalysisHave feedback on this article? Concerned about the content? Get in touch with us directly. Alternatively, email editorial-team (at) simplywallst.com.This article by Simply Wall St is general in nature. We provide commentary based on historical data and analyst forecasts only using an unbiased methodology and our articles are not intended to be financial advice. It does not constitute a recommendation to buy or sell any stock, and does not take account of your objectives, or your financial situation. We aim to bring you long-term focused analysis driven by fundamental data. Note that our analysis may not factor in the latest price-sensitive company announcements or qualitative material. Simply Wall St has no position in any stocks mentioned.
Disclaimer: Investing carries risk. This is not financial advice. The above content should not be regarded as an offer, recommendation, or solicitation on acquiring or disposing of any financial products, any associated discussions, comments, or posts by author or other users should not be considered as such either. It is solely for general information purpose only, which does not consider your own investment objectives, financial situations or needs. TTM assumes no responsibility or warranty for the accuracy and completeness of the information, investors should do their own research and may seek professional advice before investing.
Most Discussed
- 1
- 2
- 3
- 4
- 5
- 6
- 7
- 8
- 9
- 10