An Intrinsic Calculation For China Everbright Environment Group Limited (HKG:257) Suggests It's 45% Undervalued
Key Insights
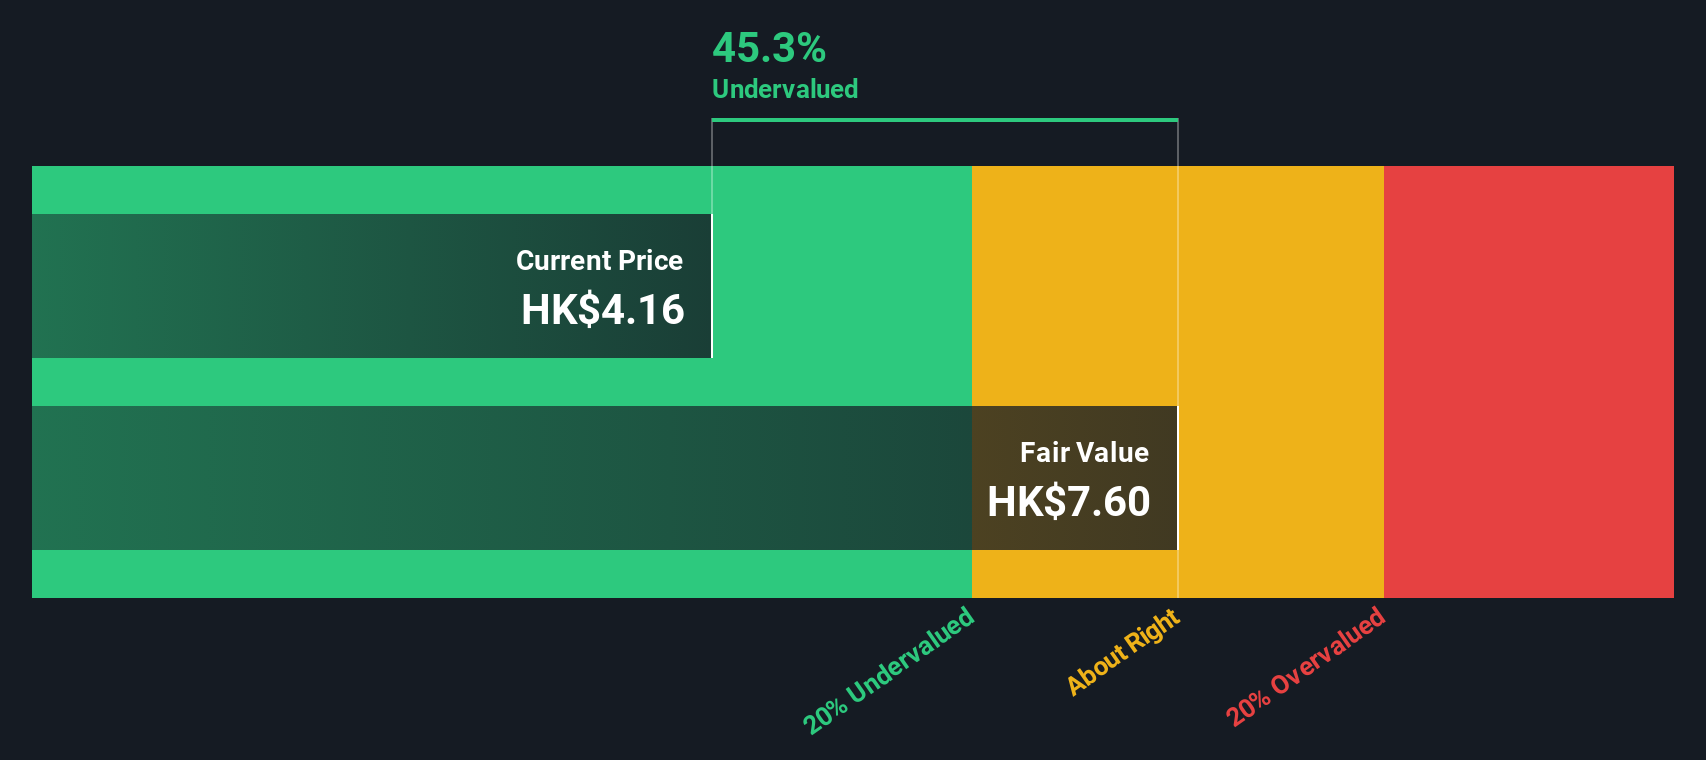
- China Everbright Environment Group's estimated fair value is HK$7.60 based on 2 Stage Free Cash Flow to Equity
- China Everbright Environment Group is estimated to be 45% undervalued based on current share price of HK$4.16
- Our fair value estimate is 73% higher than China Everbright Environment Group's analyst price target of HK$4.41
Today we'll do a simple run through of a valuation method used to estimate the attractiveness of China Everbright Environment Group Limited (HKG:257) as an investment opportunity by estimating the company's future cash flows and discounting them to their present value. This will be done using the Discounted Cash Flow (DCF) model. There's really not all that much to it, even though it might appear quite complex.
We generally believe that a company's value is the present value of all of the cash it will generate in the future. However, a DCF is just one valuation metric among many, and it is not without flaws. If you want to learn more about discounted cash flow, the rationale behind this calculation can be read in detail in the Simply Wall St analysis model.
This technology could replace computers: discover the 20 stocks are working to make quantum computing a reality.
The Model
We're using the 2-stage growth model, which simply means we take in account two stages of company's growth. In the initial period the company may have a higher growth rate and the second stage is usually assumed to have a stable growth rate. In the first stage we need to estimate the cash flows to the business over the next ten years. Where possible we use analyst estimates, but when these aren't available we extrapolate the previous free cash flow (FCF) from the last estimate or reported value. We assume companies with shrinking free cash flow will slow their rate of shrinkage, and that companies with growing free cash flow will see their growth rate slow, over this period. We do this to reflect that growth tends to slow more in the early years than it does in later years.
Generally we assume that a dollar today is more valuable than a dollar in the future, and so the sum of these future cash flows is then discounted to today's value:
10-year free cash flow (FCF) estimate
| 2026 | 2027 | 2028 | 2029 | 2030 | 2031 | 2032 | 2033 | 2034 | 2035 | |
| Levered FCF (HK$, Millions) | HK$4.34b | HK$4.66b | HK$4.90b | HK$5.12b | HK$5.32b | HK$5.51b | HK$5.69b | HK$5.86b | HK$6.03b | HK$6.20b |
| Growth Rate Estimate Source | Analyst x2 | Analyst x2 | Est @ 5.27% | Est @ 4.47% | Est @ 3.90% | Est @ 3.51% | Est @ 3.23% | Est @ 3.04% | Est @ 2.91% | Est @ 2.81% |
| Present Value (HK$, Millions) Discounted @ 13% | HK$3.8k | HK$3.7k | HK$3.4k | HK$3.2k | HK$2.9k | HK$2.7k | HK$2.4k | HK$2.2k | HK$2.0k | HK$1.9k |
("Est" = FCF growth rate estimated by Simply Wall St)Present Value of 10-year Cash Flow (PVCF) = HK$28b
After calculating the present value of future cash flows in the initial 10-year period, we need to calculate the Terminal Value, which accounts for all future cash flows beyond the first stage. For a number of reasons a very conservative growth rate is used that cannot exceed that of a country's GDP growth. In this case we have used the 5-year average of the 10-year government bond yield (2.6%) to estimate future growth. In the same way as with the 10-year 'growth' period, we discount future cash flows to today's value, using a cost of equity of 13%.
Terminal Value (TV)= FCF2035 × (1 + g) ÷ (r – g) = HK$6.2b× (1 + 2.6%) ÷ (13%– 2.6%) = HK$62b
Present Value of Terminal Value (PVTV)= TV / (1 + r)10= HK$62b÷ ( 1 + 13%)10= HK$19b
The total value is the sum of cash flows for the next ten years plus the discounted terminal value, which results in the Total Equity Value, which in this case is HK$47b. In the final step we divide the equity value by the number of shares outstanding. Compared to the current share price of HK$4.2, the company appears quite undervalued at a 45% discount to where the stock price trades currently. Valuations are imprecise instruments though, rather like a telescope - move a few degrees and end up in a different galaxy. Do keep this in mind.
The Assumptions
We would point out that the most important inputs to a discounted cash flow are the discount rate and of course the actual cash flows. You don't have to agree with these inputs, I recommend redoing the calculations yourself and playing with them. The DCF also does not consider the possible cyclicality of an industry, or a company's future capital requirements, so it does not give a full picture of a company's potential performance. Given that we are looking at China Everbright Environment Group as potential shareholders, the cost of equity is used as the discount rate, rather than the cost of capital (or weighted average cost of capital, WACC) which accounts for debt. In this calculation we've used 13%, which is based on a levered beta of 2.000. Beta is a measure of a stock's volatility, compared to the market as a whole. We get our beta from the industry average beta of globally comparable companies, with an imposed limit between 0.8 and 2.0, which is a reasonable range for a stable business.
See our latest analysis for China Everbright Environment Group
SWOT Analysis for China Everbright Environment Group
- Debt is well covered by earnings.
- Dividends are covered by earnings and cash flows.
- Dividend information for 257.
- Earnings declined over the past year.
- Dividend is low compared to the top 25% of dividend payers in the Commercial Services market.
- Annual earnings are forecast to grow for the next 3 years.
- Good value based on P/E ratio and estimated fair value.
- Debt is not well covered by operating cash flow.
- Annual earnings are forecast to grow slower than the Hong Kong market.
- Is 257 well equipped to handle threats?
Next Steps:
Although the valuation of a company is important, it ideally won't be the sole piece of analysis you scrutinize for a company. DCF models are not the be-all and end-all of investment valuation. Preferably you'd apply different cases and assumptions and see how they would impact the company's valuation. For example, changes in the company's cost of equity or the risk free rate can significantly impact the valuation. Why is the intrinsic value higher than the current share price? For China Everbright Environment Group, there are three essential aspects you should further examine:
- Risks: As an example, we've found 3 warning signs for China Everbright Environment Group (1 is concerning!) that you need to consider before investing here.
- Future Earnings: How does 257's growth rate compare to its peers and the wider market? Dig deeper into the analyst consensus number for the upcoming years by interacting with our free analyst growth expectation chart.
- Other High Quality Alternatives: Do you like a good all-rounder? Explore our interactive list of high quality stocks to get an idea of what else is out there you may be missing!
PS. The Simply Wall St app conducts a discounted cash flow valuation for every stock on the SEHK every day. If you want to find the calculation for other stocks just search here.
New: AI Stock Screener & Alerts
Our new AI Stock Screener scans the market every day to uncover opportunities.
• Dividend Powerhouses (3%+ Yield)• Undervalued Small Caps with Insider Buying• High growth Tech and AI CompaniesOr build your own from over 50 metrics.
Explore Now for FreeHave feedback on this article? Concerned about the content? Get in touch with us directly. Alternatively, email editorial-team (at) simplywallst.com.This article by Simply Wall St is general in nature. We provide commentary based on historical data and analyst forecasts only using an unbiased methodology and our articles are not intended to be financial advice. It does not constitute a recommendation to buy or sell any stock, and does not take account of your objectives, or your financial situation. We aim to bring you long-term focused analysis driven by fundamental data. Note that our analysis may not factor in the latest price-sensitive company announcements or qualitative material. Simply Wall St has no position in any stocks mentioned.
Disclaimer: Investing carries risk. This is not financial advice. The above content should not be regarded as an offer, recommendation, or solicitation on acquiring or disposing of any financial products, any associated discussions, comments, or posts by author or other users should not be considered as such either. It is solely for general information purpose only, which does not consider your own investment objectives, financial situations or needs. TTM assumes no responsibility or warranty for the accuracy and completeness of the information, investors should do their own research and may seek professional advice before investing.
Most Discussed
- 1
- 2
- 3
- 4
- 5
- 6
- 7
- 8
- 9
- 10