What You Can Learn From Warner Music Group Corp.'s (NASDAQ:WMG) P/E
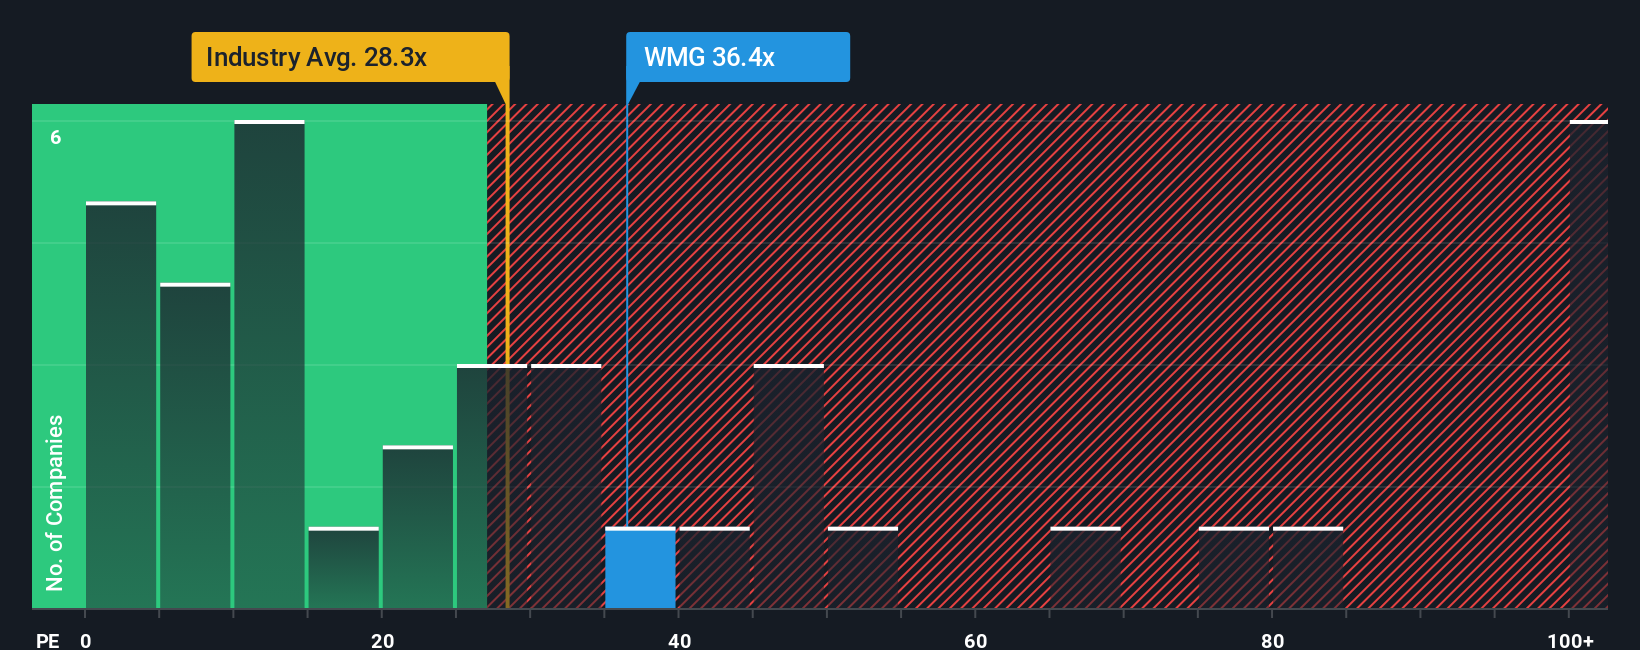
With a price-to-earnings (or "P/E") ratio of 36.4x Warner Music Group Corp. (NASDAQ:WMG) may be sending very bearish signals at the moment, given that almost half of all companies in the United States have P/E ratios under 18x and even P/E's lower than 11x are not unusual. Nonetheless, we'd need to dig a little deeper to determine if there is a rational basis for the highly elevated P/E.
We've found 21 US stocks that are forecast to pay a dividend yield of over 6% next year. See the full list for free.
Warner Music Group hasn't been tracking well recently as its declining earnings compare poorly to other companies, which have seen some growth on average. It might be that many expect the dour earnings performance to recover substantially, which has kept the P/E from collapsing. If not, then existing shareholders may be extremely nervous about the viability of the share price.
See our latest analysis for Warner Music Group
Is There Enough Growth For Warner Music Group?
There's an inherent assumption that a company should far outperform the market for P/E ratios like Warner Music Group's to be considered reasonable.
Retrospectively, the last year delivered a frustrating 15% decrease to the company's bottom line. That put a dampener on the good run it was having over the longer-term as its three-year EPS growth is still a noteworthy 21% in total. So we can start by confirming that the company has generally done a good job of growing earnings over that time, even though it had some hiccups along the way.
Looking ahead now, EPS is anticipated to climb by 22% each year during the coming three years according to the analysts following the company. That's shaping up to be materially higher than the 11% per year growth forecast for the broader market.
With this information, we can see why Warner Music Group is trading at such a high P/E compared to the market. It seems most investors are expecting this strong future growth and are willing to pay more for the stock.
What We Can Learn From Warner Music Group's P/E?
Typically, we'd caution against reading too much into price-to-earnings ratios when settling on investment decisions, though it can reveal plenty about what other market participants think about the company.
We've established that Warner Music Group maintains its high P/E on the strength of its forecast growth being higher than the wider market, as expected. Right now shareholders are comfortable with the P/E as they are quite confident future earnings aren't under threat. Unless these conditions change, they will continue to provide strong support to the share price.
Before you take the next step, you should know about the 2 warning signs for Warner Music Group that we have uncovered.
It's important to make sure you look for a great company, not just the first idea you come across. So take a peek at this free list of interesting companies with strong recent earnings growth (and a low P/E).
Valuation is complex, but we're here to simplify it.
Discover if Warner Music Group might be undervalued or overvalued with our detailed analysis, featuring fair value estimates, potential risks, dividends, insider trades, and its financial condition.
Access Free AnalysisHave feedback on this article? Concerned about the content? Get in touch with us directly. Alternatively, email editorial-team (at) simplywallst.com.This article by Simply Wall St is general in nature. We provide commentary based on historical data and analyst forecasts only using an unbiased methodology and our articles are not intended to be financial advice. It does not constitute a recommendation to buy or sell any stock, and does not take account of your objectives, or your financial situation. We aim to bring you long-term focused analysis driven by fundamental data. Note that our analysis may not factor in the latest price-sensitive company announcements or qualitative material. Simply Wall St has no position in any stocks mentioned.
Disclaimer: Investing carries risk. This is not financial advice. The above content should not be regarded as an offer, recommendation, or solicitation on acquiring or disposing of any financial products, any associated discussions, comments, or posts by author or other users should not be considered as such either. It is solely for general information purpose only, which does not consider your own investment objectives, financial situations or needs. TTM assumes no responsibility or warranty for the accuracy and completeness of the information, investors should do their own research and may seek professional advice before investing.
Most Discussed
- 1
- 2
- 3
- 4
- 5
- 6
- 7
- 8
- 9
- 10