Leader Education (HKG:1449) Will Be Hoping To Turn Its Returns On Capital Around
If we want to find a potential multi-bagger, often there are underlying trends that can provide clues. Firstly, we'll want to see a proven return on capital employed (ROCE) that is increasing, and secondly, an expanding base of capital employed. Basically this means that a company has profitable initiatives that it can continue to reinvest in, which is a trait of a compounding machine. However, after investigating Leader Education (HKG:1449), we don't think it's current trends fit the mold of a multi-bagger.
We've found 21 US stocks that are forecast to pay a dividend yield of over 6% next year. See the full list for free.
Return On Capital Employed (ROCE): What Is It?
For those that aren't sure what ROCE is, it measures the amount of pre-tax profits a company can generate from the capital employed in its business. The formula for this calculation on Leader Education is:
Return on Capital Employed = Earnings Before Interest and Tax (EBIT) ÷ (Total Assets - Current Liabilities)
0.041 = CN¥66m ÷ (CN¥2.4b - CN¥800m) (Based on the trailing twelve months to February 2025).
Therefore, Leader Education has an ROCE of 4.1%. Ultimately, that's a low return and it under-performs the Consumer Services industry average of 9.2%.
See our latest analysis for Leader Education
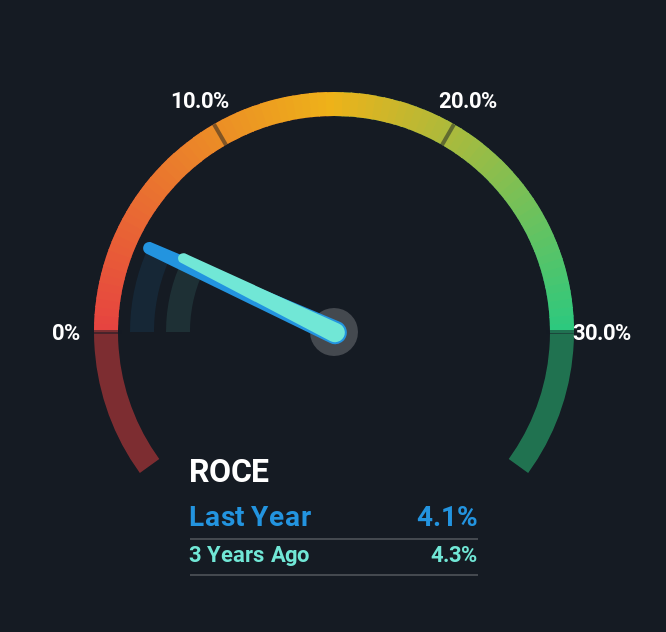
Historical performance is a great place to start when researching a stock so above you can see the gauge for Leader Education's ROCE against it's prior returns. If you'd like to look at how Leader Education has performed in the past in other metrics, you can view this free graph of Leader Education's past earnings, revenue and cash flow.
The Trend Of ROCE
When we looked at the ROCE trend at Leader Education, we didn't gain much confidence. To be more specific, ROCE has fallen from 5.7% over the last five years. However, given capital employed and revenue have both increased it appears that the business is currently pursuing growth, at the consequence of short term returns. If these investments prove successful, this can bode very well for long term stock performance.
On a side note, Leader Education's current liabilities have increased over the last five years to 33% of total assets, effectively distorting the ROCE to some degree. If current liabilities hadn't increased as much as they did, the ROCE could actually be even lower. While the ratio isn't currently too high, it's worth keeping an eye on this because if it gets particularly high, the business could then face some new elements of risk.
What We Can Learn From Leader Education's ROCE
Even though returns on capital have fallen in the short term, we find it promising that revenue and capital employed have both increased for Leader Education. And the stock has followed suit returning a meaningful 25% to shareholders over the last three years. So while the underlying trends could already be accounted for by investors, we still think this stock is worth looking into further.
Since virtually every company faces some risks, it's worth knowing what they are, and we've spotted 3 warning signs for Leader Education (of which 1 can't be ignored!) that you should know about.
While Leader Education isn't earning the highest return, check out this free list of companies that are earning high returns on equity with solid balance sheets.
New: AI Stock Screener & Alerts
Our new AI Stock Screener scans the market every day to uncover opportunities.
• Dividend Powerhouses (3%+ Yield)• Undervalued Small Caps with Insider Buying• High growth Tech and AI CompaniesOr build your own from over 50 metrics.
Explore Now for FreeHave feedback on this article? Concerned about the content? Get in touch with us directly. Alternatively, email editorial-team (at) simplywallst.com.This article by Simply Wall St is general in nature. We provide commentary based on historical data and analyst forecasts only using an unbiased methodology and our articles are not intended to be financial advice. It does not constitute a recommendation to buy or sell any stock, and does not take account of your objectives, or your financial situation. We aim to bring you long-term focused analysis driven by fundamental data. Note that our analysis may not factor in the latest price-sensitive company announcements or qualitative material. Simply Wall St has no position in any stocks mentioned.
Disclaimer: Investing carries risk. This is not financial advice. The above content should not be regarded as an offer, recommendation, or solicitation on acquiring or disposing of any financial products, any associated discussions, comments, or posts by author or other users should not be considered as such either. It is solely for general information purpose only, which does not consider your own investment objectives, financial situations or needs. TTM assumes no responsibility or warranty for the accuracy and completeness of the information, investors should do their own research and may seek professional advice before investing.
Most Discussed
- 1
- 2
- 3
- 4
- 5
- 6
- 7
- 8
- 9
- 10