Earnings Tell The Story For Full Truck Alliance Co. Ltd. (NYSE:YMM)
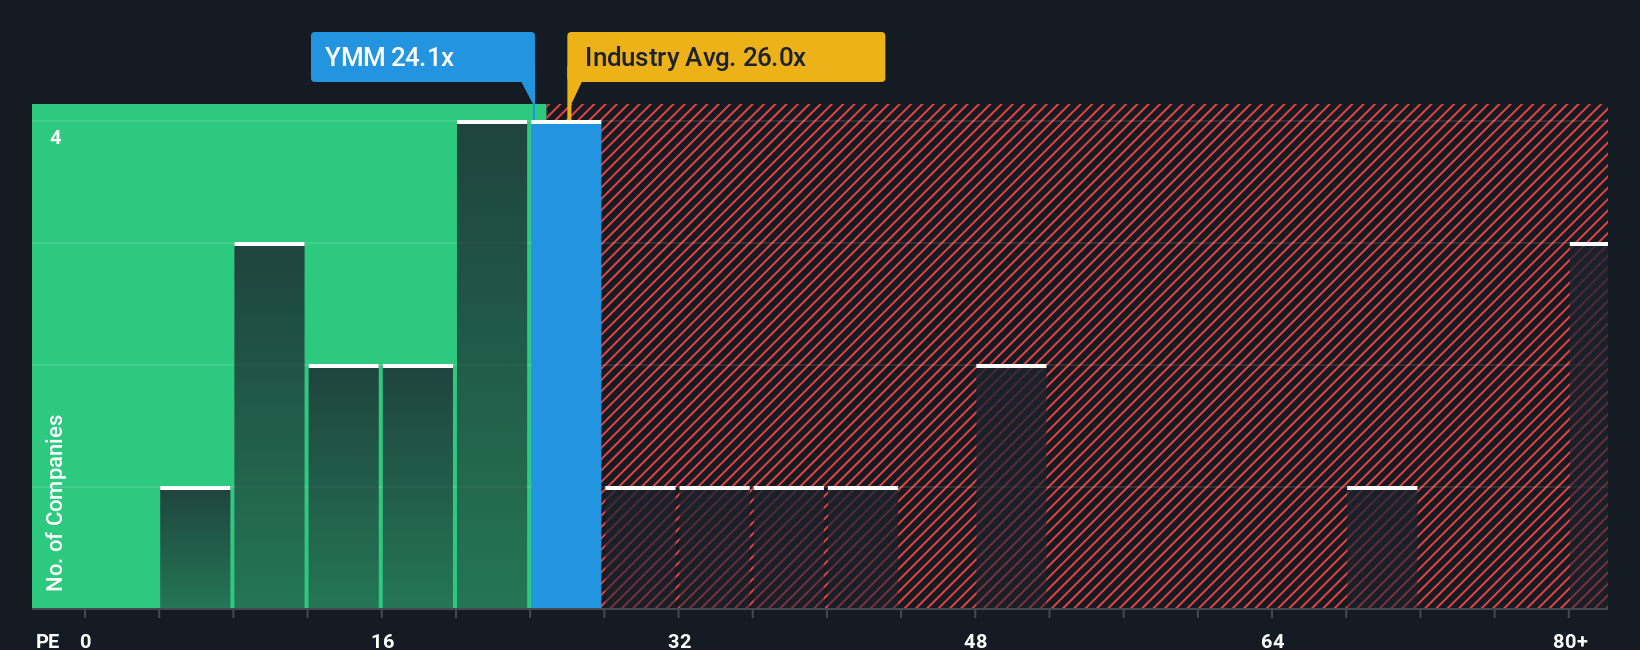
With a price-to-earnings (or "P/E") ratio of 24.1x Full Truck Alliance Co. Ltd. (NYSE:YMM) may be sending bearish signals at the moment, given that almost half of all companies in the United States have P/E ratios under 19x and even P/E's lower than 11x are not unusual. However, the P/E might be high for a reason and it requires further investigation to determine if it's justified.
We've found 21 US stocks that are forecast to pay a dividend yield of over 6% next year. See the full list for free.
Full Truck Alliance certainly has been doing a good job lately as it's been growing earnings more than most other companies. It seems that many are expecting the strong earnings performance to persist, which has raised the P/E. If not, then existing shareholders might be a little nervous about the viability of the share price.
View our latest analysis for Full Truck Alliance
How Is Full Truck Alliance's Growth Trending?
There's an inherent assumption that a company should outperform the market for P/E ratios like Full Truck Alliance's to be considered reasonable.
Taking a look back first, we see that the company grew earnings per share by an impressive 59% last year. Although, its longer-term performance hasn't been as strong with three-year EPS growth being relatively non-existent overall. Accordingly, shareholders probably wouldn't have been overly satisfied with the unstable medium-term growth rates.
Looking ahead now, EPS is anticipated to climb by 23% per year during the coming three years according to the analysts following the company. Meanwhile, the rest of the market is forecast to only expand by 10% per annum, which is noticeably less attractive.
In light of this, it's understandable that Full Truck Alliance's P/E sits above the majority of other companies. Apparently shareholders aren't keen to offload something that is potentially eyeing a more prosperous future.
The Final Word
It's argued the price-to-earnings ratio is an inferior measure of value within certain industries, but it can be a powerful business sentiment indicator.
We've established that Full Truck Alliance maintains its high P/E on the strength of its forecast growth being higher than the wider market, as expected. Right now shareholders are comfortable with the P/E as they are quite confident future earnings aren't under threat. Unless these conditions change, they will continue to provide strong support to the share price.
A lot of potential risks can sit within a company's balance sheet. Our free balance sheet analysis for Full Truck Alliance with six simple checks will allow you to discover any risks that could be an issue.
If these risks are making you reconsider your opinion on Full Truck Alliance, explore our interactive list of high quality stocks to get an idea of what else is out there.
New: AI Stock Screener & Alerts
Our new AI Stock Screener scans the market every day to uncover opportunities.
• Dividend Powerhouses (3%+ Yield)• Undervalued Small Caps with Insider Buying• High growth Tech and AI CompaniesOr build your own from over 50 metrics.
Explore Now for FreeHave feedback on this article? Concerned about the content? Get in touch with us directly. Alternatively, email editorial-team (at) simplywallst.com.This article by Simply Wall St is general in nature. We provide commentary based on historical data and analyst forecasts only using an unbiased methodology and our articles are not intended to be financial advice. It does not constitute a recommendation to buy or sell any stock, and does not take account of your objectives, or your financial situation. We aim to bring you long-term focused analysis driven by fundamental data. Note that our analysis may not factor in the latest price-sensitive company announcements or qualitative material. Simply Wall St has no position in any stocks mentioned.
Disclaimer: Investing carries risk. This is not financial advice. The above content should not be regarded as an offer, recommendation, or solicitation on acquiring or disposing of any financial products, any associated discussions, comments, or posts by author or other users should not be considered as such either. It is solely for general information purpose only, which does not consider your own investment objectives, financial situations or needs. TTM assumes no responsibility or warranty for the accuracy and completeness of the information, investors should do their own research and may seek professional advice before investing.
Most Discussed
- 1
- 2
- 3
- 4
- 5
- 6
- 7
- 8
- 9
- 10