These Return Metrics Don't Make Zumiez (NASDAQ:ZUMZ) Look Too Strong
When researching a stock for investment, what can tell us that the company is in decline? More often than not, we'll see a declining return on capital employed (ROCE) and a declining amount of capital employed. Basically the company is earning less on its investments and it is also reducing its total assets. On that note, looking into Zumiez (NASDAQ:ZUMZ), we weren't too upbeat about how things were going.
AI is about to change healthcare. These 20 stocks are working on everything from early diagnostics to drug discovery. The best part - they are all under $10bn in marketcap - there is still time to get in early.
Understanding Return On Capital Employed (ROCE)
Just to clarify if you're unsure, ROCE is a metric for evaluating how much pre-tax income (in percentage terms) a company earns on the capital invested in its business. To calculate this metric for Zumiez, this is the formula:
Return on Capital Employed = Earnings Before Interest and Tax (EBIT) ÷ (Total Assets - Current Liabilities)
0.015 = US$6.6m ÷ (US$599m - US$147m) (Based on the trailing twelve months to May 2025).
Thus, Zumiez has an ROCE of 1.5%. In absolute terms, that's a low return and it also under-performs the Specialty Retail industry average of 13%.
Check out our latest analysis for Zumiez
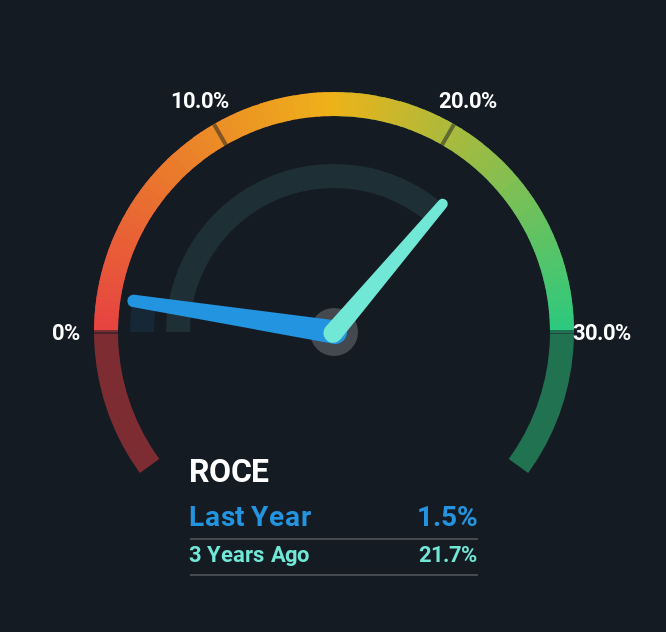
Above you can see how the current ROCE for Zumiez compares to its prior returns on capital, but there's only so much you can tell from the past. If you'd like to see what analysts are forecasting going forward, you should check out our free analyst report for Zumiez .
What Does the ROCE Trend For Zumiez Tell Us?
In terms of Zumiez's historical ROCE trend, it isn't fantastic. To be more specific, today's ROCE was 8.1% five years ago but has since fallen to 1.5%. On top of that, the business is utilizing 36% less capital within its operations. The combination of lower ROCE and less capital employed can indicate that a business is likely to be facing some competitive headwinds or seeing an erosion to its moat. If these underlying trends continue, we wouldn't be too optimistic going forward.
In Conclusion...
In short, lower returns and decreasing amounts capital employed in the business doesn't fill us with confidence. Long term shareholders who've owned the stock over the last five years have experienced a 36% depreciation in their investment, so it appears the market might not like these trends either. Unless there is a shift to a more positive trajectory in these metrics, we would look elsewhere.
If you want to continue researching Zumiez, you might be interested to know about the 2 warning signs that our analysis has discovered.
For those who like to invest in solid companies, check out this free list of companies with solid balance sheets and high returns on equity.
Valuation is complex, but we're here to simplify it.
Discover if Zumiez might be undervalued or overvalued with our detailed analysis, featuring fair value estimates, potential risks, dividends, insider trades, and its financial condition.
Access Free AnalysisHave feedback on this article? Concerned about the content? Get in touch with us directly. Alternatively, email editorial-team (at) simplywallst.com.This article by Simply Wall St is general in nature. We provide commentary based on historical data and analyst forecasts only using an unbiased methodology and our articles are not intended to be financial advice. It does not constitute a recommendation to buy or sell any stock, and does not take account of your objectives, or your financial situation. We aim to bring you long-term focused analysis driven by fundamental data. Note that our analysis may not factor in the latest price-sensitive company announcements or qualitative material. Simply Wall St has no position in any stocks mentioned.
Disclaimer: Investing carries risk. This is not financial advice. The above content should not be regarded as an offer, recommendation, or solicitation on acquiring or disposing of any financial products, any associated discussions, comments, or posts by author or other users should not be considered as such either. It is solely for general information purpose only, which does not consider your own investment objectives, financial situations or needs. TTM assumes no responsibility or warranty for the accuracy and completeness of the information, investors should do their own research and may seek professional advice before investing.
Most Discussed
- 1
- 2
- 3
- 4
- 5
- 6
- 7
- 8
- 9
- 10