ASX Penny Stocks To Watch In July 2025
The Australian market has recently experienced a remarkable trading run, with the ASX hitting all-time highs despite some geopolitical tensions. As traders anticipate potential interest rate cuts and key speeches that could influence market dynamics, attention is also turning to smaller investment opportunities. Penny stocks, though an older term, continue to capture interest due to their affordability and growth potential; they often represent newer companies with strong financials that can lead to significant returns.
Top 10 Penny Stocks In Australia
| Name | Share Price | Market Cap | Rewards & Risks |
| Alfabs Australia (ASX:AAL) | A$0.415 | A$118.93M | ✅ 3 ⚠️ 3 View Analysis > |
| EZZ Life Science Holdings (ASX:EZZ) | A$2.31 | A$108.97M | ✅ 4 ⚠️ 3 View Analysis > |
| GTN (ASX:GTN) | A$0.59 | A$112.49M | ✅ 3 ⚠️ 2 View Analysis > |
| IVE Group (ASX:IGL) | A$3.14 | A$484.13M | ✅ 4 ⚠️ 2 View Analysis > |
| West African Resources (ASX:WAF) | A$2.25 | A$2.56B | ✅ 5 ⚠️ 1 View Analysis > |
| Southern Cross Electrical Engineering (ASX:SXE) | A$1.80 | A$475.94M | ✅ 4 ⚠️ 1 View Analysis > |
| Regal Partners (ASX:RPL) | A$2.66 | A$894.36M | ✅ 4 ⚠️ 2 View Analysis > |
| Sugar Terminals (NSX:SUG) | A$0.99 | A$360M | ✅ 2 ⚠️ 2 View Analysis > |
| Accent Group (ASX:AX1) | A$1.515 | A$910.8M | ✅ 3 ⚠️ 2 View Analysis > |
| CTI Logistics (ASX:CLX) | A$1.90 | A$153.03M | ✅ 4 ⚠️ 2 View Analysis > |
Click here to see the full list of 458 stocks from our ASX Penny Stocks screener.
Here we highlight a subset of our preferred stocks from the screener.
PolyNovo (ASX:PNV)
Simply Wall St Financial Health Rating: ★★★★☆☆
Overview: PolyNovo Limited designs, manufactures, and sells biodegradable medical devices in the United States, Australia, New Zealand, and internationally with a market cap of A$870.46 million.
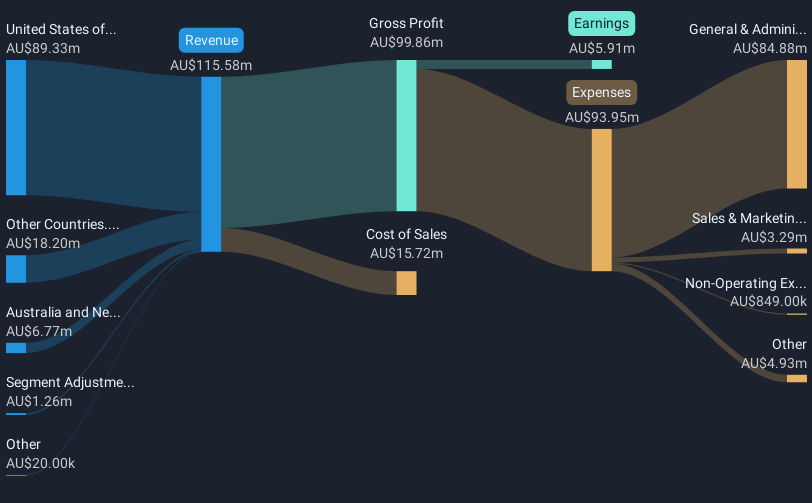
Operations: PolyNovo generates revenue of A$115.58 million from the development, manufacturing, and commercialisation of its NovoSorb technology.
Market Cap: A$870.46M
PolyNovo Limited, with a market cap of A$870.46 million and revenue of A$115.58 million, has shown significant earnings growth over the past year at 270.2%, surpassing the Medical Equipment industry average. Despite trading below its estimated fair value and having more cash than debt, concerns include low return on equity at 7.8% and negative operating cash flow affecting debt coverage. The company benefits from an experienced board but has a relatively new management team with an average tenure of 1.5 years, which may impact strategic continuity as it navigates future growth opportunities in its sector.
- Get an in-depth perspective on PolyNovo's performance by reading our balance sheet health report here.
- Gain insights into PolyNovo's future direction by reviewing our growth report.
Renascor Resources (ASX:RNU)
Simply Wall St Financial Health Rating: ★★★★★★
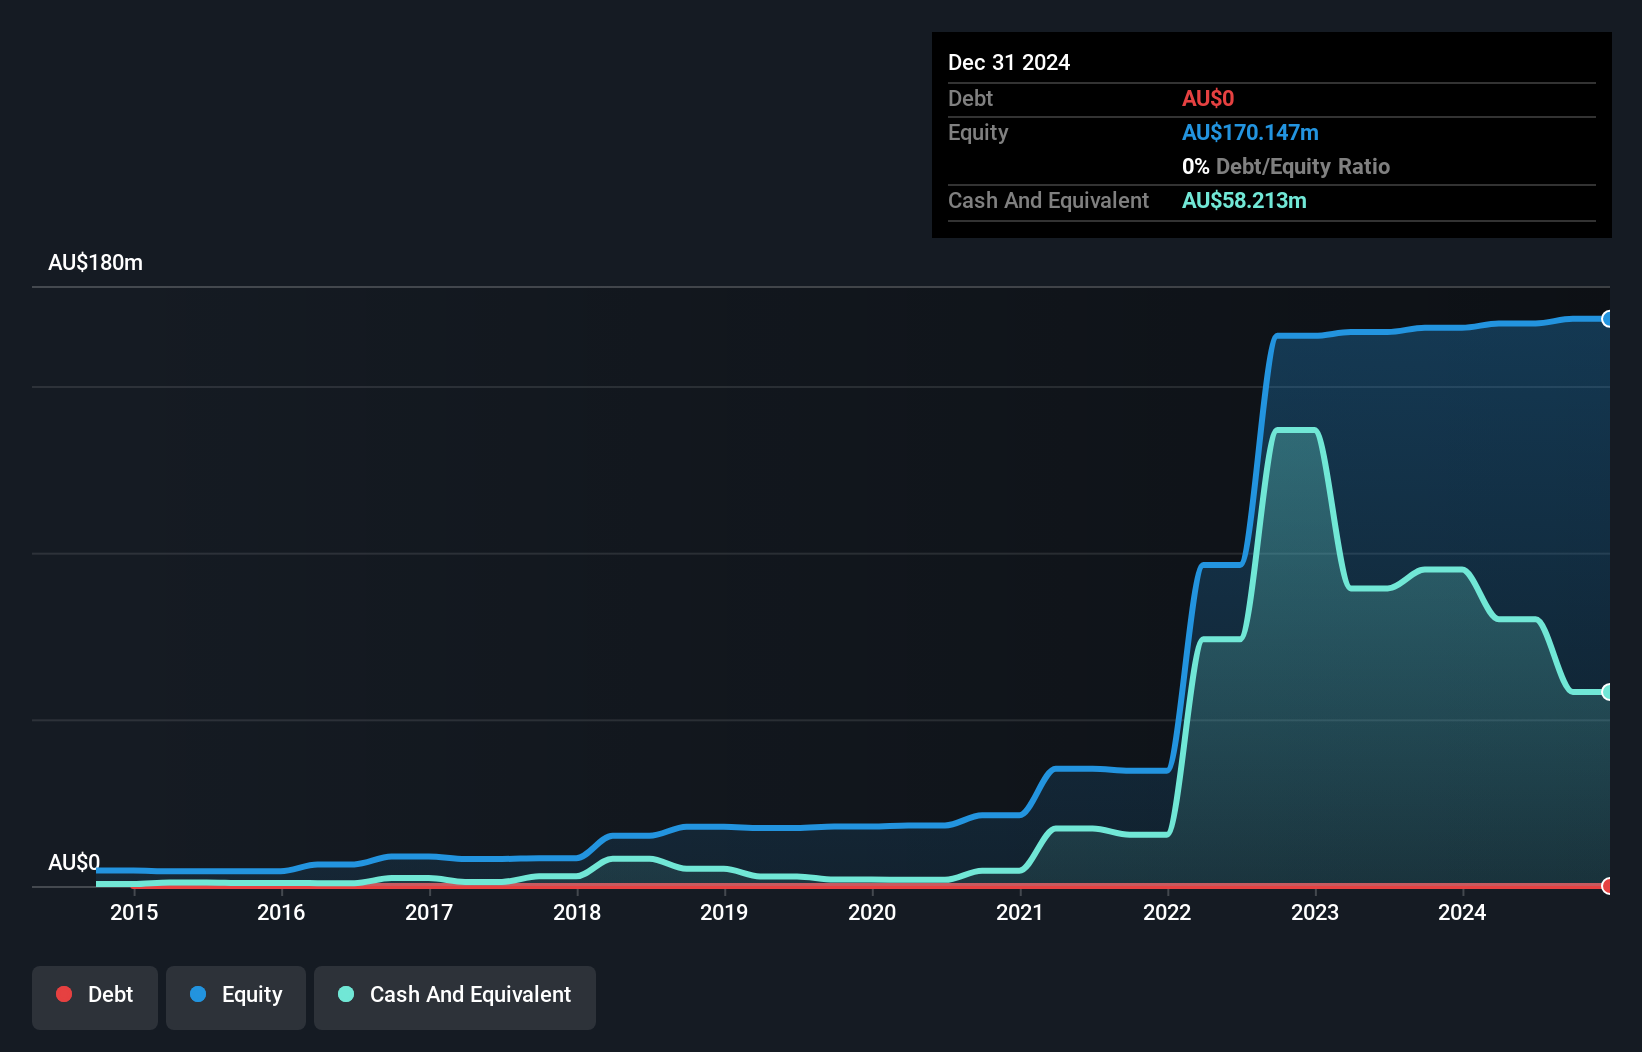
Overview: Renascor Resources Limited focuses on the exploration, development, and evaluation of mineral properties in Australia and has a market cap of A$180.56 million.
Operations: The company generates revenue from its exploration activities for graphite, copper, gold, uranium, and other minerals amounting to A$0.075 million.
Market Cap: A$180.56M
Renascor Resources, with a market cap of A$180.56 million, is pre-revenue, generating only A$0.075 million from exploration activities. The company remains debt-free and has short-term assets of A$109.8 million significantly covering its liabilities, indicating financial stability despite a highly volatile share price over the past three months. While it has grown earnings by 56.7% annually over five years to become profitable, recent earnings growth has been negative at -0.5%. The board is seasoned with an average tenure of 14.8 years; however, management experience data is insufficient for evaluation following executive changes in June 2025.
- Click to explore a detailed breakdown of our findings in Renascor Resources' financial health report.
- Learn about Renascor Resources' historical performance here.
Service Stream (ASX:SSM)
Simply Wall St Financial Health Rating: ★★★★★★
Overview: Service Stream Limited is an Australian company involved in the design, construction, operation, and maintenance of infrastructure networks across the telecommunications, utilities, and transport sectors with a market cap of A$1.21 billion.
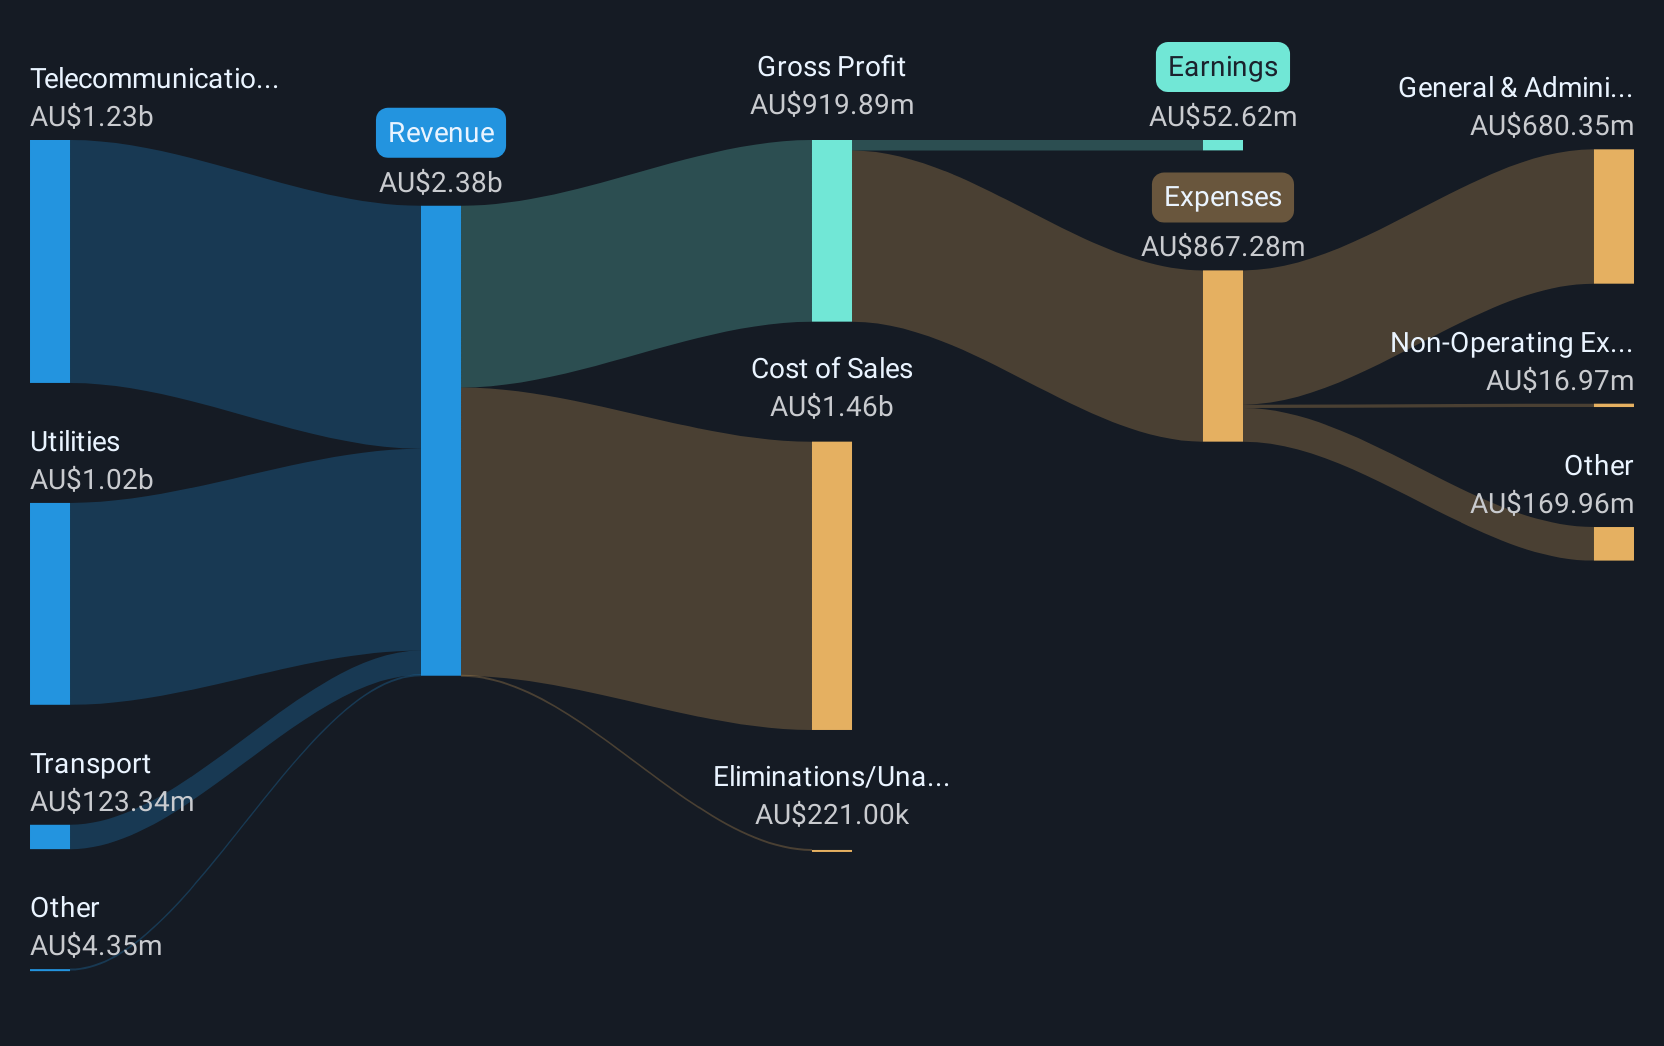
Operations: Service Stream's revenue is primarily derived from its Telecommunications segment at A$1.23 billion, followed by Utilities at A$1.02 billion, and Transport contributing A$123.34 million.
Market Cap: A$1.21B
Service Stream Limited, with a market cap of A$1.21 billion, is trading at 49.5% below its estimated fair value, presenting potential investment appeal among penny stocks. The company has shown impressive earnings growth of 124.7% over the past year, outperforming the broader construction industry. Service Stream's financial health is robust with short-term assets exceeding both short and long-term liabilities and no debt on its balance sheet. Despite these strengths, insider selling in recent months and a relatively inexperienced board could pose challenges for investors seeking stability in governance structures.
- Navigate through the intricacies of Service Stream with our comprehensive balance sheet health report here.
- Learn about Service Stream's future growth trajectory here.
Make It Happen
- Explore the 458 names from our ASX Penny Stocks screener here.
- Looking For Alternative Opportunities? Trump has pledged to "unleash" American oil and gas and these 22 US stocks have developments that are poised to benefit.
This article by Simply Wall St is general in nature. We provide commentary based on historical data and analyst forecasts only using an unbiased methodology and our articles are not intended to be financial advice. It does not constitute a recommendation to buy or sell any stock, and does not take account of your objectives, or your financial situation. We aim to bring you long-term focused analysis driven by fundamental data. Note that our analysis may not factor in the latest price-sensitive company announcements or qualitative material. Simply Wall St has no position in any stocks mentioned.
New: AI Stock Screener & Alerts
Our new AI Stock Screener scans the market every day to uncover opportunities.
• Dividend Powerhouses (3%+ Yield)• Undervalued Small Caps with Insider Buying• High growth Tech and AI CompaniesOr build your own from over 50 metrics.
Explore Now for FreeHave feedback on this article? Concerned about the content? Get in touch with us directly. Alternatively, email editorial-team@simplywallst.com
Disclaimer: Investing carries risk. This is not financial advice. The above content should not be regarded as an offer, recommendation, or solicitation on acquiring or disposing of any financial products, any associated discussions, comments, or posts by author or other users should not be considered as such either. It is solely for general information purpose only, which does not consider your own investment objectives, financial situations or needs. TTM assumes no responsibility or warranty for the accuracy and completeness of the information, investors should do their own research and may seek professional advice before investing.
Most Discussed
- 1
- 2
- 3
- 4
- 5
- 6
- 7
- 8
- 9
- 10