Is HealthEquity, Inc.'s (NASDAQ:HQY) Recent Stock Performance Influenced By Its Fundamentals In Any Way?
HealthEquity (NASDAQ:HQY) has had a great run on the share market with its stock up by a significant 13% over the last three months. Given that stock prices are usually aligned with a company's financial performance in the long-term, we decided to study its financial indicators more closely to see if they had a hand to play in the recent price move. Specifically, we decided to study HealthEquity's ROE in this article.
ROE or return on equity is a useful tool to assess how effectively a company can generate returns on the investment it received from its shareholders. In simpler terms, it measures the profitability of a company in relation to shareholder's equity.
AI is about to change healthcare. These 20 stocks are working on everything from early diagnostics to drug discovery. The best part - they are all under $10bn in marketcap - there is still time to get in early.
How Do You Calculate Return On Equity?
The formula for return on equity is:
Return on Equity = Net Profit (from continuing operations) ÷ Shareholders' Equity
So, based on the above formula, the ROE for HealthEquity is:
5.7% = US$122m ÷ US$2.1b (Based on the trailing twelve months to April 2025).
The 'return' refers to a company's earnings over the last year. Another way to think of that is that for every $1 worth of equity, the company was able to earn $0.06 in profit.
View our latest analysis for HealthEquity
What Is The Relationship Between ROE And Earnings Growth?
So far, we've learned that ROE is a measure of a company's profitability. Depending on how much of these profits the company reinvests or "retains", and how effectively it does so, we are then able to assess a company’s earnings growth potential. Assuming all else is equal, companies that have both a higher return on equity and higher profit retention are usually the ones that have a higher growth rate when compared to companies that don't have the same features.
HealthEquity's Earnings Growth And 5.7% ROE
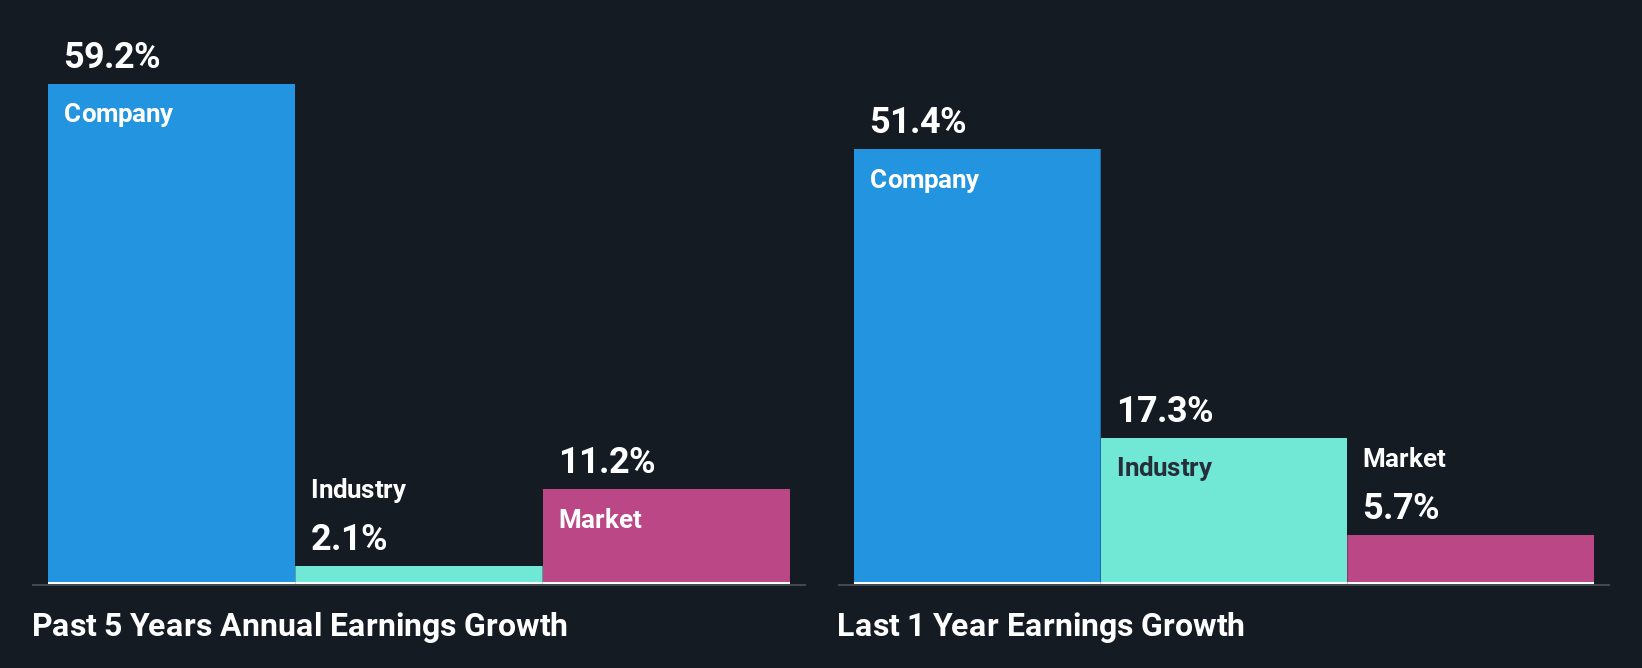
On the face of it, HealthEquity's ROE is not much to talk about. We then compared the company's ROE to the broader industry and were disappointed to see that the ROE is lower than the industry average of 11%. In spite of this, HealthEquity was able to grow its net income considerably, at a rate of 59% in the last five years. So, there might be other aspects that are positively influencing the company's earnings growth. For example, it is possible that the company's management has made some good strategic decisions, or that the company has a low payout ratio.
Next, on comparing with the industry net income growth, we found that HealthEquity's growth is quite high when compared to the industry average growth of 2.1% in the same period, which is great to see.
The basis for attaching value to a company is, to a great extent, tied to its earnings growth. What investors need to determine next is if the expected earnings growth, or the lack of it, is already built into the share price. By doing so, they will have an idea if the stock is headed into clear blue waters or if swampy waters await. Has the market priced in the future outlook for HQY? You can find out in our latest intrinsic value infographic research report.
Is HealthEquity Using Its Retained Earnings Effectively?
Given that HealthEquity doesn't pay any regular dividends to its shareholders, we infer that the company has been reinvesting all of its profits to grow its business.
Conclusion
Overall, we feel that HealthEquity certainly does have some positive factors to consider. Even in spite of the low rate of return, the company has posted impressive earnings growth as a result of reinvesting heavily into its business. That being so, a study of the latest analyst forecasts show that the company is expected to see a slowdown in its future earnings growth. Are these analysts expectations based on the broad expectations for the industry, or on the company's fundamentals? Click here to be taken to our analyst's forecasts page for the company.
Valuation is complex, but we're here to simplify it.
Discover if HealthEquity might be undervalued or overvalued with our detailed analysis, featuring fair value estimates, potential risks, dividends, insider trades, and its financial condition.
Access Free AnalysisHave feedback on this article? Concerned about the content? Get in touch with us directly. Alternatively, email editorial-team (at) simplywallst.com.This article by Simply Wall St is general in nature. We provide commentary based on historical data and analyst forecasts only using an unbiased methodology and our articles are not intended to be financial advice. It does not constitute a recommendation to buy or sell any stock, and does not take account of your objectives, or your financial situation. We aim to bring you long-term focused analysis driven by fundamental data. Note that our analysis may not factor in the latest price-sensitive company announcements or qualitative material. Simply Wall St has no position in any stocks mentioned.
Disclaimer: Investing carries risk. This is not financial advice. The above content should not be regarded as an offer, recommendation, or solicitation on acquiring or disposing of any financial products, any associated discussions, comments, or posts by author or other users should not be considered as such either. It is solely for general information purpose only, which does not consider your own investment objectives, financial situations or needs. TTM assumes no responsibility or warranty for the accuracy and completeness of the information, investors should do their own research and may seek professional advice before investing.
Most Discussed
- 1
- 2
- 3
- 4
- 5
- 6
- 7
- 8
- 9
- 10