3 Stocks That May Be Trading Below Their Estimated Value In July 2025
In a market environment where major indices like the S&P 500 and Nasdaq are reaching new highs, investors are closely monitoring earnings reports and economic data for signs of continued growth amidst trade uncertainties. Identifying undervalued stocks in such a buoyant market can provide opportunities for those looking to capitalize on discrepancies between current prices and intrinsic values.
Top 10 Undervalued Stocks Based On Cash Flows In The United States
| Name | Current Price | Fair Value (Est) | Discount (Est) |
| Royal Gold (RGLD) | $154.76 | $298.88 | 48.2% |
| Robert Half (RHI) | $41.86 | $82.60 | 49.3% |
| Repligen (RGEN) | $116.25 | $224.90 | 48.3% |
| Rapid7 (RPD) | $22.31 | $43.54 | 48.8% |
| e.l.f. Beauty (ELF) | $117.63 | $229.71 | 48.8% |
| Carter Bankshares (CARE) | $18.17 | $35.50 | 48.8% |
| Camden National (CAC) | $42.27 | $83.80 | 49.6% |
| Atlantic Union Bankshares (AUB) | $33.22 | $65.45 | 49.2% |
| ACNB (ACNB) | $43.03 | $85.02 | 49.4% |
| Acadia Realty Trust (AKR) | $18.55 | $36.68 | 49.4% |
Click here to see the full list of 173 stocks from our Undervalued US Stocks Based On Cash Flows screener.
Let's dive into some prime choices out of the screener.
Extreme Networks (EXTR)
Overview: Extreme Networks, Inc. provides software-driven networking solutions worldwide and has a market cap of approximately $2.33 billion.
Operations: The company's revenue is primarily derived from the development and marketing of network infrastructure equipment and related software, totaling approximately $1.09 billion.
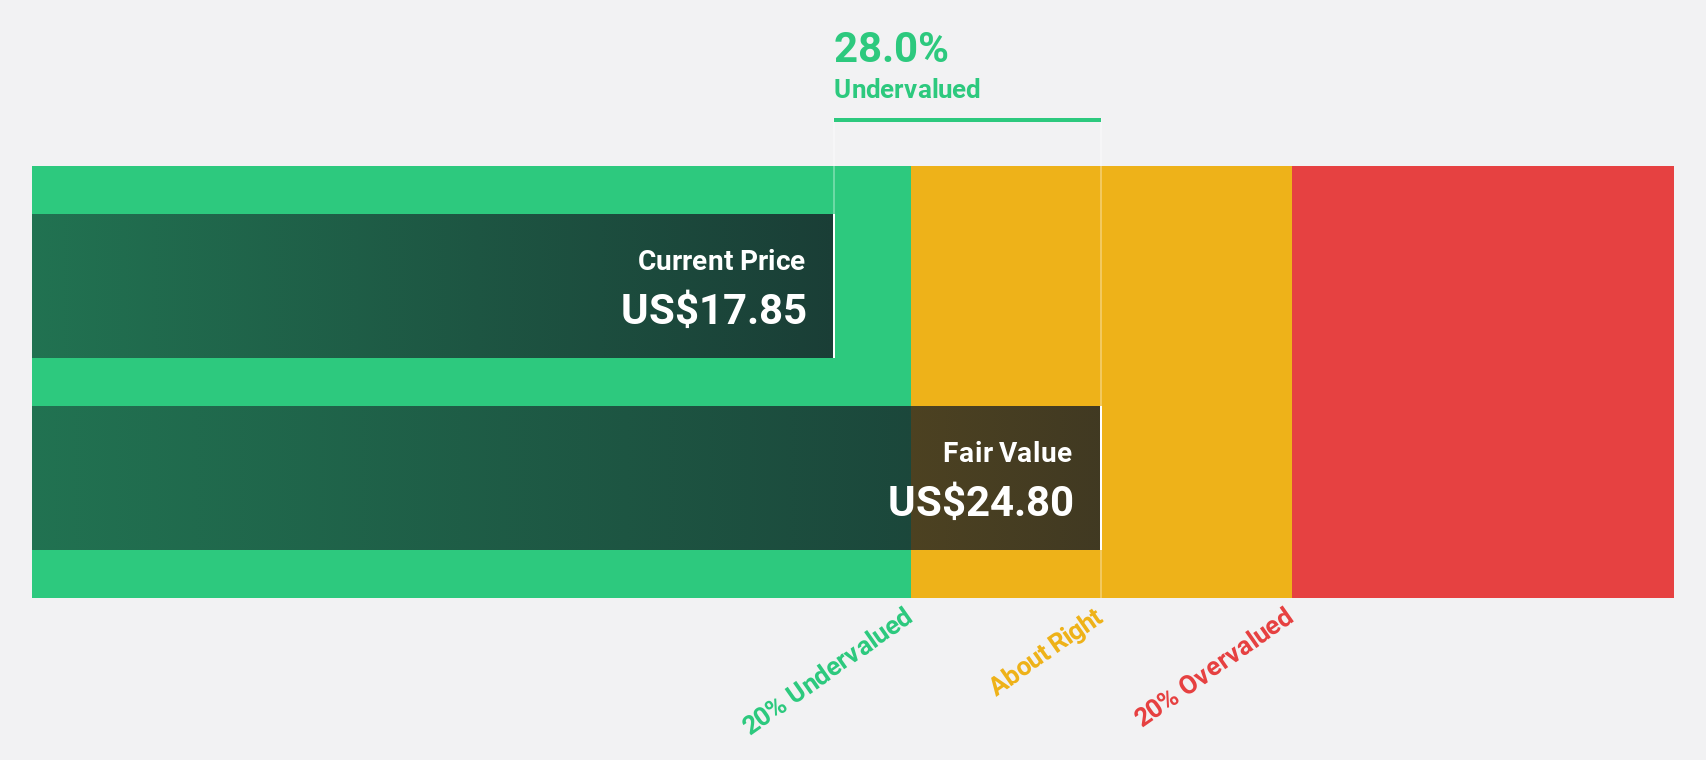
Estimated Discount To Fair Value: 29.3%
Extreme Networks is trading at US$17.52, significantly below its estimated fair value of US$24.8, suggesting it may be undervalued based on cash flows. Forecasted earnings growth of over 100% annually and a high future return on equity highlight strong potential profitability. Despite slower revenue growth compared to the market, recent product innovations like Extreme Platform ONE enhance operational efficiency and network management capabilities, potentially driving future financial performance amidst index exclusions and completed share buybacks.
- The growth report we've compiled suggests that Extreme Networks' future prospects could be on the up.
- Take a closer look at Extreme Networks' balance sheet health here in our report.
Somnigroup International (SGI)
Overview: Somnigroup International Inc., along with its subsidiaries, is involved in the design, manufacture, distribution, and retail of bedding products both in the United States and internationally, with a market cap of $15.29 billion.
Operations: Somnigroup International Inc. generates its revenue through the design, manufacture, distribution, and retail of bedding products across domestic and international markets.
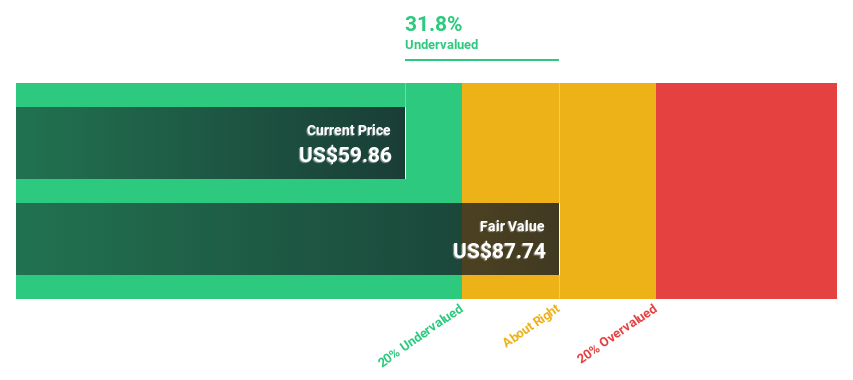
Estimated Discount To Fair Value: 15.7%
Somnigroup International, trading at US$73.32, is below its estimated fair value of US$86.95, reflecting potential undervaluation based on cash flows. Forecasted earnings growth of 24% annually surpasses the broader U.S. market's growth expectations. However, recent shareholder dilution and debt refinancing highlight financial restructuring efforts; a repriced $1.6 billion term loan aims for annualized cash interest savings of up to $9 million if leverage targets are met, enhancing future cash flow potential amidst slower revenue expansion than desired.
- Our growth report here indicates Somnigroup International may be poised for an improving outlook.
- Click here to discover the nuances of Somnigroup International with our detailed financial health report.
Similarweb (SMWB)
Overview: Similarweb Ltd. offers digital data and analytics services to support essential business decisions across various regions, including the United States, Europe, the Asia Pacific, the United Kingdom, Israel, and internationally; it has a market cap of approximately $715.92 million.
Operations: The company's revenue primarily comes from its On Line Financial Information Providers segment, generating $258.02 million.
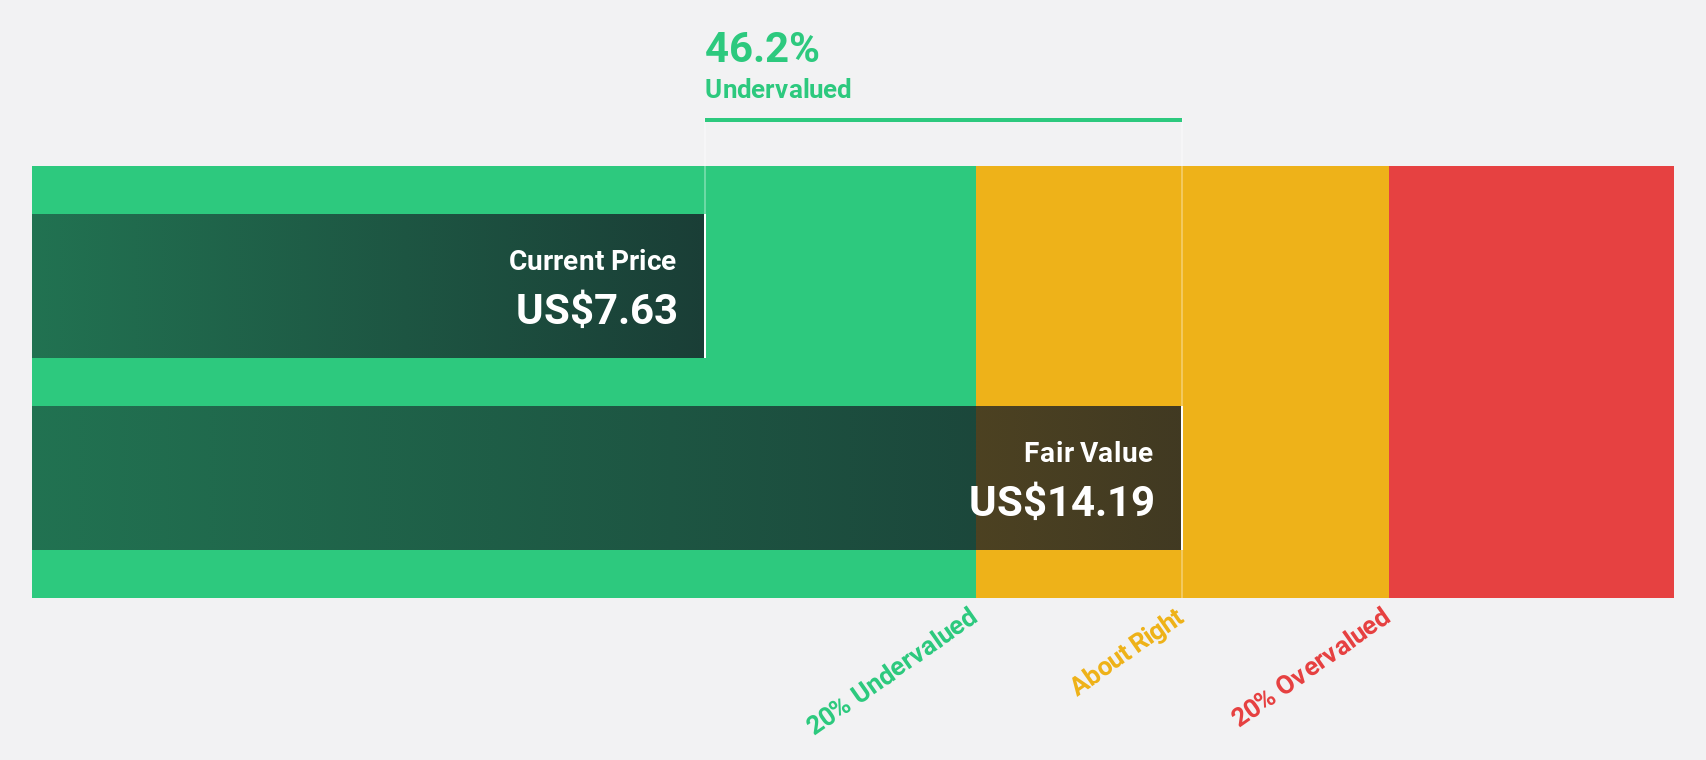
Estimated Discount To Fair Value: 45.7%
Similarweb, trading at US$8.57, is valued below its estimated fair value of US$15.79, suggesting it might be undervalued based on cash flows. The company anticipates revenue growth of 14.2% annually and aims to achieve profitability within three years, surpassing average market expectations. Recent product innovations, like the launch of AI Agents for SEO and sales optimization, could enhance its competitive edge and drive future cash flow improvements despite current net losses.
- According our earnings growth report, there's an indication that Similarweb might be ready to expand.
- Dive into the specifics of Similarweb here with our thorough financial health report.
Make It Happen
- Embark on your investment journey to our 173 Undervalued US Stocks Based On Cash Flows selection here.
- Invested in any of these stocks? Simplify your portfolio management with Simply Wall St and stay ahead with our alerts for any critical updates on your stocks.
- Take control of your financial future using Simply Wall St, offering free, in-depth knowledge of international markets to every investor.
Contemplating Other Strategies?
- Explore high-performing small cap companies that haven't yet garnered significant analyst attention.
- Diversify your portfolio with solid dividend payers offering reliable income streams to weather potential market turbulence.
- Fuel your portfolio with companies showing strong growth potential, backed by optimistic outlooks both from analysts and management.
This article by Simply Wall St is general in nature. We provide commentary based on historical data and analyst forecasts only using an unbiased methodology and our articles are not intended to be financial advice. It does not constitute a recommendation to buy or sell any stock, and does not take account of your objectives, or your financial situation. We aim to bring you long-term focused analysis driven by fundamental data. Note that our analysis may not factor in the latest price-sensitive company announcements or qualitative material. Simply Wall St has no position in any stocks mentioned.
New: Manage All Your Stock Portfolios in One Place
We've created the ultimate portfolio companion for stock investors, and it's free.
• Connect an unlimited number of Portfolios and see your total in one currency• Be alerted to new Warning Signs or Risks via email or mobile• Track the Fair Value of your stocks
Try a Demo Portfolio for FreeHave feedback on this article? Concerned about the content? Get in touch with us directly. Alternatively, email editorial-team@simplywallst.com
Disclaimer: Investing carries risk. This is not financial advice. The above content should not be regarded as an offer, recommendation, or solicitation on acquiring or disposing of any financial products, any associated discussions, comments, or posts by author or other users should not be considered as such either. It is solely for general information purpose only, which does not consider your own investment objectives, financial situations or needs. TTM assumes no responsibility or warranty for the accuracy and completeness of the information, investors should do their own research and may seek professional advice before investing.
Most Discussed
- 1
- 2
- 3
- 4
- 5
- 6
- 7
- 8
- 9
- 10