3 Penny Stocks Under $300M Market Cap To Consider
Major stock indexes in the United States have reached new highs, driven by strong corporate earnings and positive economic indicators. For investors seeking opportunities beyond the well-known giants, penny stocks—often representing smaller or newer companies—can offer intriguing prospects. Despite their vintage name, these stocks can provide a unique chance for growth at lower price points, especially when they possess strong balance sheets and solid fundamentals.
Top 10 Penny Stocks In The United States
| Name | Share Price | Market Cap | Rewards & Risks |
| Waterdrop (WDH) | $1.68 | $607.59M | ✅ 4 ⚠️ 0 View Analysis > |
| CuriosityStream (CURI) | $4.62 | $266.61M | ✅ 3 ⚠️ 3 View Analysis > |
| WM Technology (MAPS) | $0.9527 | $160.22M | ✅ 4 ⚠️ 1 View Analysis > |
| Perfect (PERF) | $2.50 | $254.62M | ✅ 3 ⚠️ 0 View Analysis > |
| Tuniu (TOUR) | $0.9326 | $98.4M | ✅ 3 ⚠️ 2 View Analysis > |
| Safe Bulkers (SB) | $4.12 | $421.52M | ✅ 2 ⚠️ 3 View Analysis > |
| Cardno (COLD.F) | $0.1701 | $6.64M | ✅ 2 ⚠️ 4 View Analysis > |
| BAB (BABB) | $0.845 | $6.14M | ✅ 2 ⚠️ 3 View Analysis > |
| Lifetime Brands (LCUT) | $4.47 | $100.19M | ✅ 3 ⚠️ 2 View Analysis > |
| North European Oil Royalty Trust (NRT) | $4.88 | $44.85M | ✅ 2 ⚠️ 2 View Analysis > |
Click here to see the full list of 419 stocks from our US Penny Stocks screener.
We're going to check out a few of the best picks from our screener tool.
Kaltura (KLTR)
Simply Wall St Financial Health Rating: ★★★★★★
Overview: Kaltura, Inc. offers software-as-a-service and platform-as-a-service solutions across multiple regions including the United States, Europe, the Middle East, and Africa, with a market cap of $284.20 million.
Operations: Kaltura generates its revenue from two primary segments: Media & Telecom, which contributes $50.24 million, and Enterprise, Education and Technology, accounting for $130.68 million.
Market Cap: $284.2M
Kaltura, Inc., with a market cap of $284.20 million, operates in the software-as-a-service sector, generating revenue from Media & Telecom and Enterprise segments. Despite being unprofitable, Kaltura has shown promising signs by reducing its net loss significantly from US$11.1 million to US$1.12 million year-over-year for Q1 2025. The company maintains a strong cash position with more cash than debt and sufficient runway for over three years due to positive free cash flow growth. Recent buybacks have not meaningfully diluted shareholders, and the stock trades at a good value compared to peers and industry estimates.
- Navigate through the intricacies of Kaltura with our comprehensive balance sheet health report here.
- Gain insights into Kaltura's outlook and expected performance with our report on the company's earnings estimates.
Pulmonx (LUNG)
Simply Wall St Financial Health Rating: ★★★★★☆
Overview: Pulmonx Corporation is a commercial-stage medical technology company specializing in minimally invasive treatments for severe emphysema, with a market cap of $126.81 million.
Operations: The company generates revenue from its Medical Products segment, totaling $87.47 million.
Market Cap: $126.81M
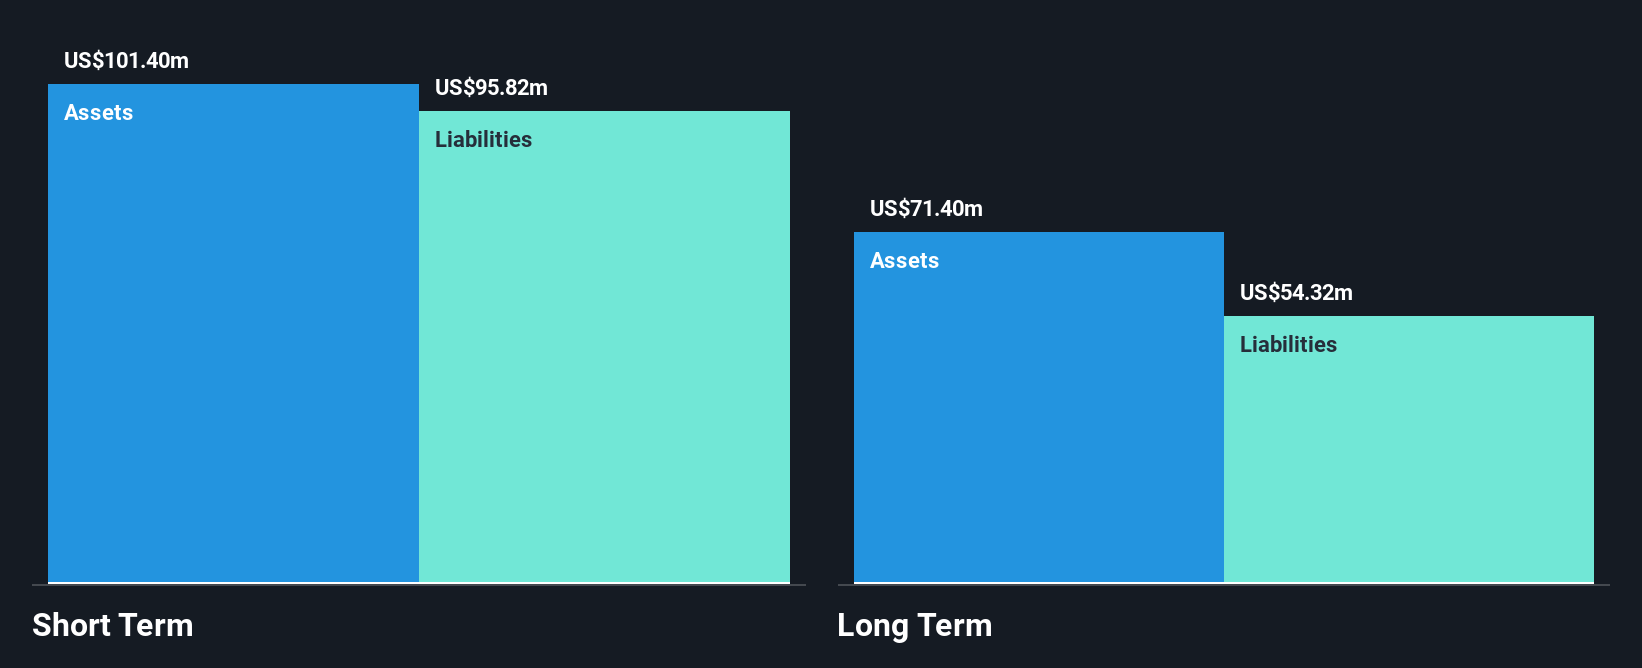
Pulmonx Corporation, with a market cap of US$126.81 million, is currently unprofitable and not expected to achieve profitability in the next three years. Despite this, the company has demonstrated revenue growth, reporting US$22.54 million for Q1 2025, up from US$18.85 million the previous year. Pulmonx's short-term assets significantly exceed both its short- and long-term liabilities, providing a solid financial footing despite ongoing losses. The company's stock is highly volatile but trades at an attractive value compared to industry peers. Recent insider selling may be a concern for potential investors considering its high volatility and negative return on equity.
- Dive into the specifics of Pulmonx here with our thorough balance sheet health report.
- Examine Pulmonx's earnings growth report to understand how analysts expect it to perform.
Magnachip Semiconductor (MX)
Simply Wall St Financial Health Rating: ★★★★★★
Overview: Magnachip Semiconductor Corporation designs, manufactures, and supplies analog and mixed-signal semiconductor platform solutions for various applications including communications, IoT, consumer electronics, computing, industrial sectors, and automotive industries with a market cap of approximately $155.79 million.
Operations: The company's revenue is primarily derived from its Power Solutions Business, specifically the Power Analog Solutions segment, which generated $170.13 million.
Market Cap: $155.79M
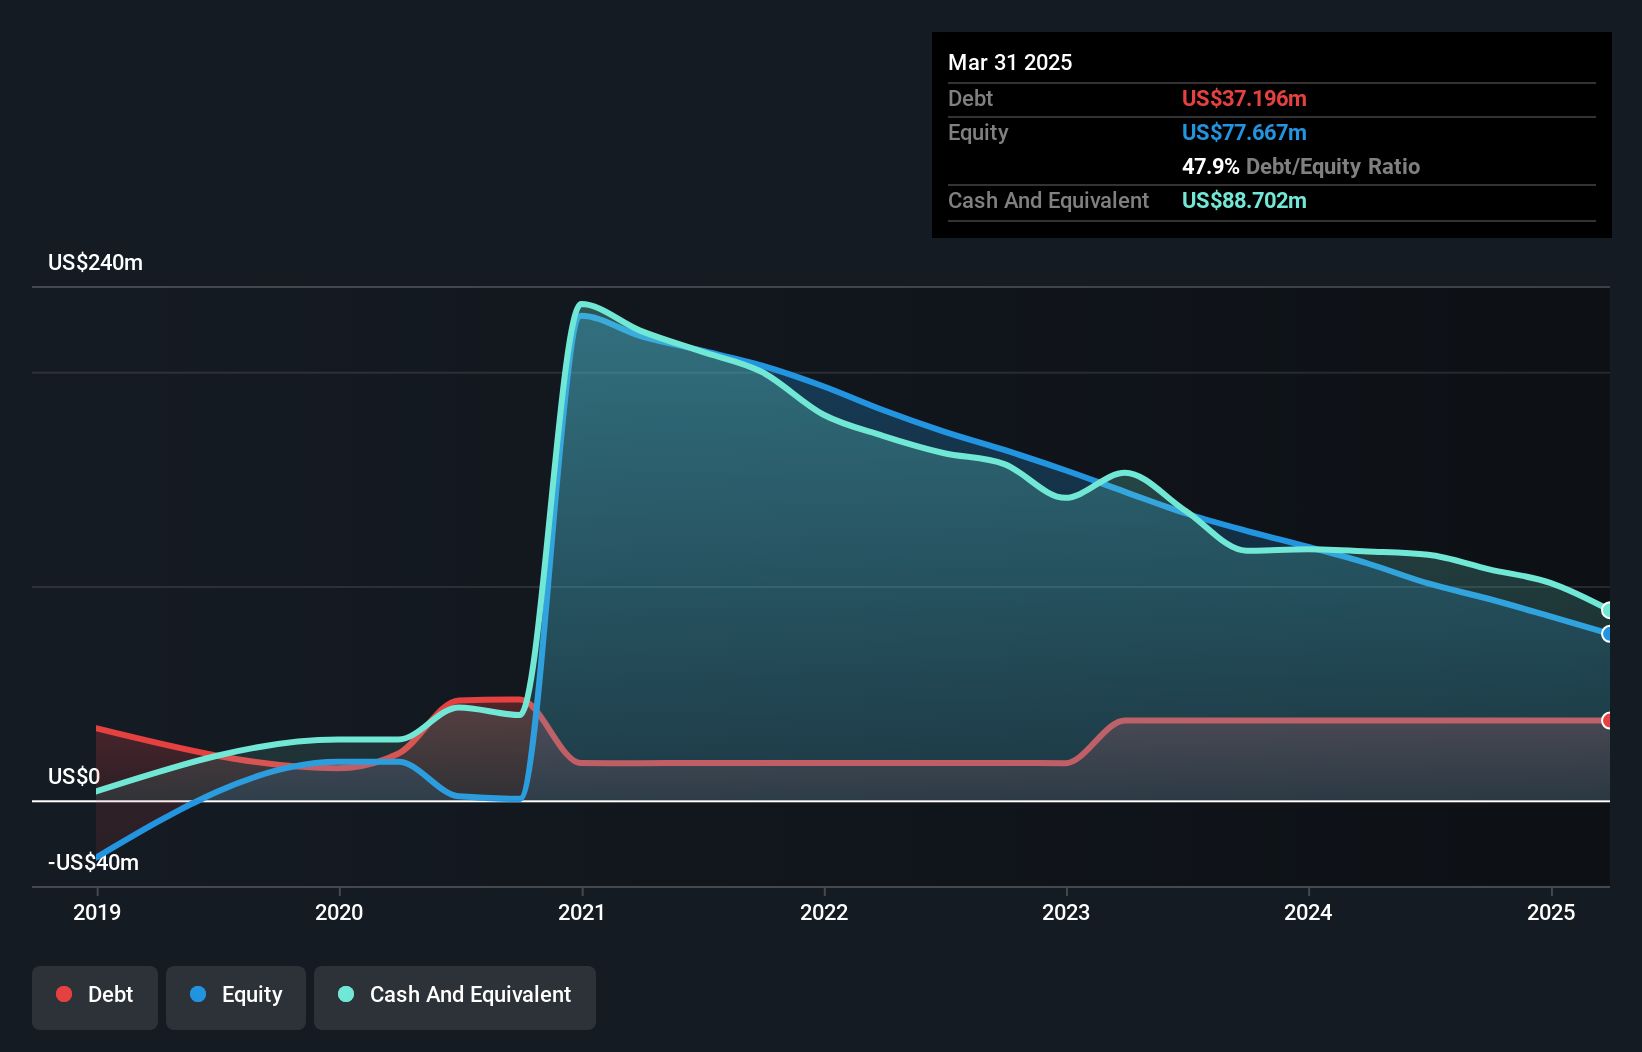
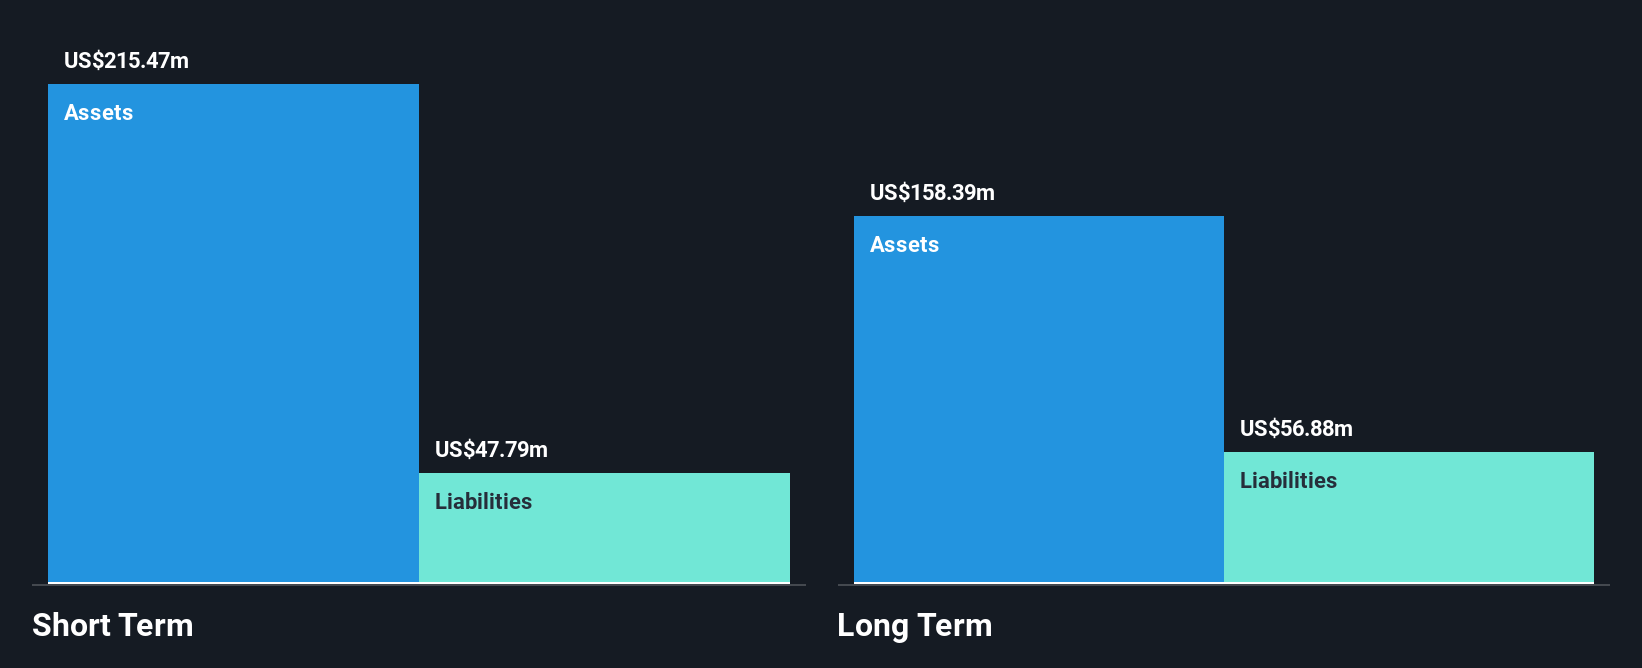
Magnachip Semiconductor, with a market cap of US$155.79 million, is currently unprofitable but has shown improvement by reducing its net loss to US$8.88 million in Q1 2025 from US$15.42 million a year ago. Its short-term assets of US$215.5 million comfortably cover both short- and long-term liabilities, suggesting financial stability despite ongoing losses. The company has more cash than debt and a sufficient cash runway for over three years even if free cash flow declines continue at historical rates. Recent share buybacks indicate management's confidence, although profitability remains elusive in the near term according to forecasts.
- Click to explore a detailed breakdown of our findings in Magnachip Semiconductor's financial health report.
- Assess Magnachip Semiconductor's future earnings estimates with our detailed growth reports.
Taking Advantage
- Embark on your investment journey to our 419 US Penny Stocks selection here.
- Contemplating Other Strategies? Outshine the giants: these 19 early-stage AI stocks could fund your retirement.
This article by Simply Wall St is general in nature. We provide commentary based on historical data and analyst forecasts only using an unbiased methodology and our articles are not intended to be financial advice. It does not constitute a recommendation to buy or sell any stock, and does not take account of your objectives, or your financial situation. We aim to bring you long-term focused analysis driven by fundamental data. Note that our analysis may not factor in the latest price-sensitive company announcements or qualitative material. Simply Wall St has no position in any stocks mentioned.
New: Manage All Your Stock Portfolios in One Place
We've created the ultimate portfolio companion for stock investors, and it's free.
• Connect an unlimited number of Portfolios and see your total in one currency• Be alerted to new Warning Signs or Risks via email or mobile• Track the Fair Value of your stocks
Try a Demo Portfolio for FreeHave feedback on this article? Concerned about the content? Get in touch with us directly. Alternatively, email editorial-team@simplywallst.com
Disclaimer: Investing carries risk. This is not financial advice. The above content should not be regarded as an offer, recommendation, or solicitation on acquiring or disposing of any financial products, any associated discussions, comments, or posts by author or other users should not be considered as such either. It is solely for general information purpose only, which does not consider your own investment objectives, financial situations or needs. TTM assumes no responsibility or warranty for the accuracy and completeness of the information, investors should do their own research and may seek professional advice before investing.
Most Discussed
- 1
- 2
- 3
- 4
- 5
- 6
- 7
- 8
- 9
- 10