Will Weakness in Oxford Industries, Inc.'s (NYSE:OXM) Stock Prove Temporary Given Strong Fundamentals?
Oxford Industries (NYSE:OXM) has had a rough three months with its share price down 12%. However, stock prices are usually driven by a company’s financial performance over the long term, which in this case looks quite promising. Specifically, we decided to study Oxford Industries' ROE in this article.
Return on equity or ROE is a key measure used to assess how efficiently a company's management is utilizing the company's capital. Put another way, it reveals the company's success at turning shareholder investments into profits.
We've found 21 US stocks that are forecast to pay a dividend yield of over 6% next year. See the full list for free.
How Do You Calculate Return On Equity?
The formula for return on equity is:
Return on Equity = Net Profit (from continuing operations) ÷ Shareholders' Equity
So, based on the above formula, the ROE for Oxford Industries is:
14% = US$81m ÷ US$592m (Based on the trailing twelve months to May 2025).
The 'return' is the profit over the last twelve months. Another way to think of that is that for every $1 worth of equity, the company was able to earn $0.14 in profit.
See our latest analysis for Oxford Industries
What Has ROE Got To Do With Earnings Growth?
We have already established that ROE serves as an efficient profit-generating gauge for a company's future earnings. Depending on how much of these profits the company reinvests or "retains", and how effectively it does so, we are then able to assess a company’s earnings growth potential. Generally speaking, other things being equal, firms with a high return on equity and profit retention, have a higher growth rate than firms that don’t share these attributes.
Oxford Industries' Earnings Growth And 14% ROE
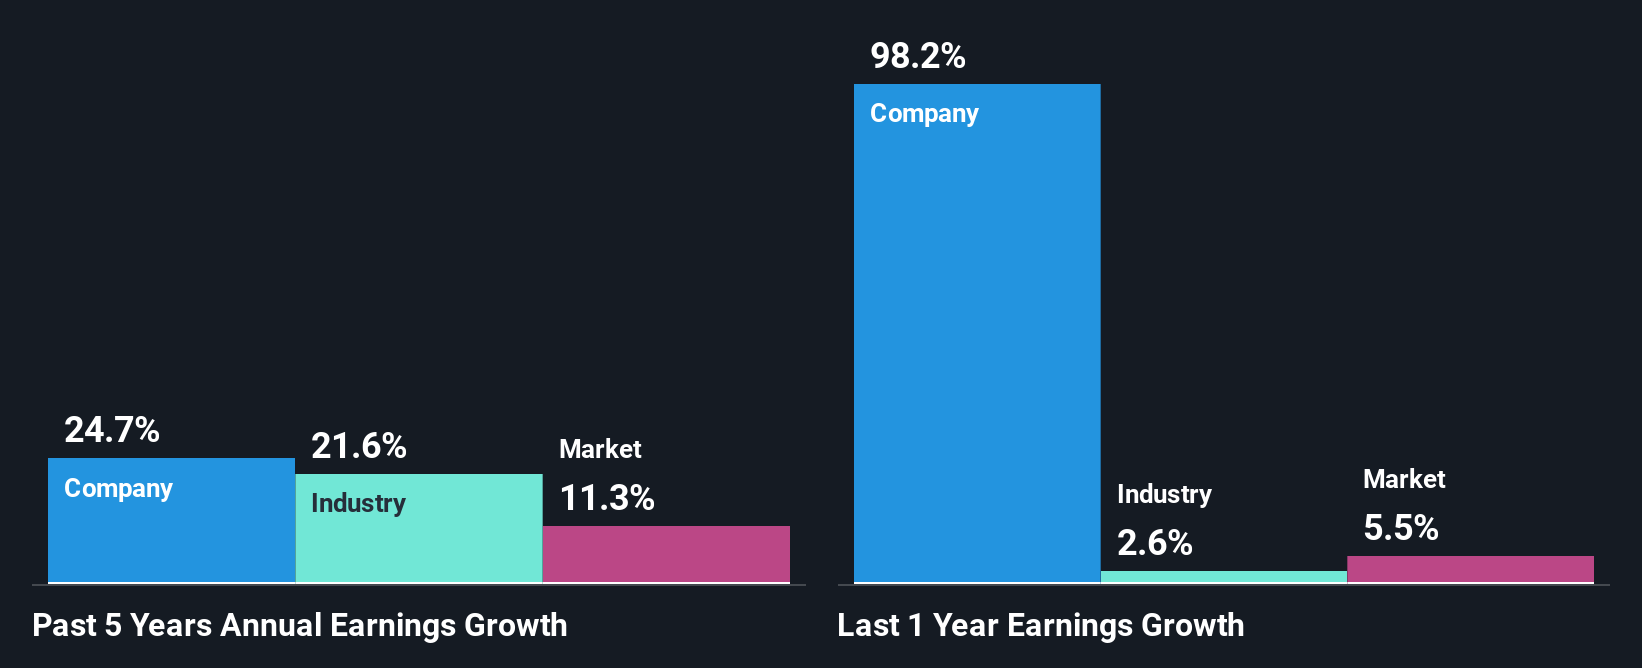
At first glance, Oxford Industries seems to have a decent ROE. Even when compared to the industry average of 14% the company's ROE looks quite decent. This certainly adds some context to Oxford Industries' exceptional 25% net income growth seen over the past five years. However, there could also be other drivers behind this growth. Such as - high earnings retention or an efficient management in place.
As a next step, we compared Oxford Industries' net income growth with the industry and found that the company has a similar growth figure when compared with the industry average growth rate of 22% in the same period.
Earnings growth is an important metric to consider when valuing a stock. It’s important for an investor to know whether the market has priced in the company's expected earnings growth (or decline). By doing so, they will have an idea if the stock is headed into clear blue waters or if swampy waters await. One good indicator of expected earnings growth is the P/E ratio which determines the price the market is willing to pay for a stock based on its earnings prospects. So, you may want to check if Oxford Industries is trading on a high P/E or a low P/E, relative to its industry.
Is Oxford Industries Efficiently Re-investing Its Profits?
The three-year median payout ratio for Oxford Industries is 35%, which is moderately low. The company is retaining the remaining 65%. This suggests that its dividend is well covered, and given the high growth we discussed above, it looks like Oxford Industries is reinvesting its earnings efficiently.
Moreover, Oxford Industries is determined to keep sharing its profits with shareholders which we infer from its long history of paying a dividend for at least ten years. Looking at the current analyst consensus data, we can see that the company's future payout ratio is expected to rise to 78% over the next three years. Therefore, the expected rise in the payout ratio explains why the company's ROE is expected to decline to 9.0% over the same period.
Conclusion
Overall, we are quite pleased with Oxford Industries' performance. Particularly, we like that the company is reinvesting heavily into its business, and at a high rate of return. Unsurprisingly, this has led to an impressive earnings growth. That being so, according to the latest industry analyst forecasts, the company's earnings are expected to shrink in the future. To know more about the latest analysts predictions for the company, check out this visualization of analyst forecasts for the company.
New: AI Stock Screener & Alerts
Our new AI Stock Screener scans the market every day to uncover opportunities.
• Dividend Powerhouses (3%+ Yield)• Undervalued Small Caps with Insider Buying• High growth Tech and AI CompaniesOr build your own from over 50 metrics.
Explore Now for FreeHave feedback on this article? Concerned about the content? Get in touch with us directly. Alternatively, email editorial-team (at) simplywallst.com.This article by Simply Wall St is general in nature. We provide commentary based on historical data and analyst forecasts only using an unbiased methodology and our articles are not intended to be financial advice. It does not constitute a recommendation to buy or sell any stock, and does not take account of your objectives, or your financial situation. We aim to bring you long-term focused analysis driven by fundamental data. Note that our analysis may not factor in the latest price-sensitive company announcements or qualitative material. Simply Wall St has no position in any stocks mentioned.
Disclaimer: Investing carries risk. This is not financial advice. The above content should not be regarded as an offer, recommendation, or solicitation on acquiring or disposing of any financial products, any associated discussions, comments, or posts by author or other users should not be considered as such either. It is solely for general information purpose only, which does not consider your own investment objectives, financial situations or needs. TTM assumes no responsibility or warranty for the accuracy and completeness of the information, investors should do their own research and may seek professional advice before investing.
Most Discussed
- 1
- 2
- 3
- 4
- 5
- 6
- 7
- 8
- 9
- 10