Colour Life Services Group Co., Limited's (HKG:1778) Shareholders Might Be Looking For Exit
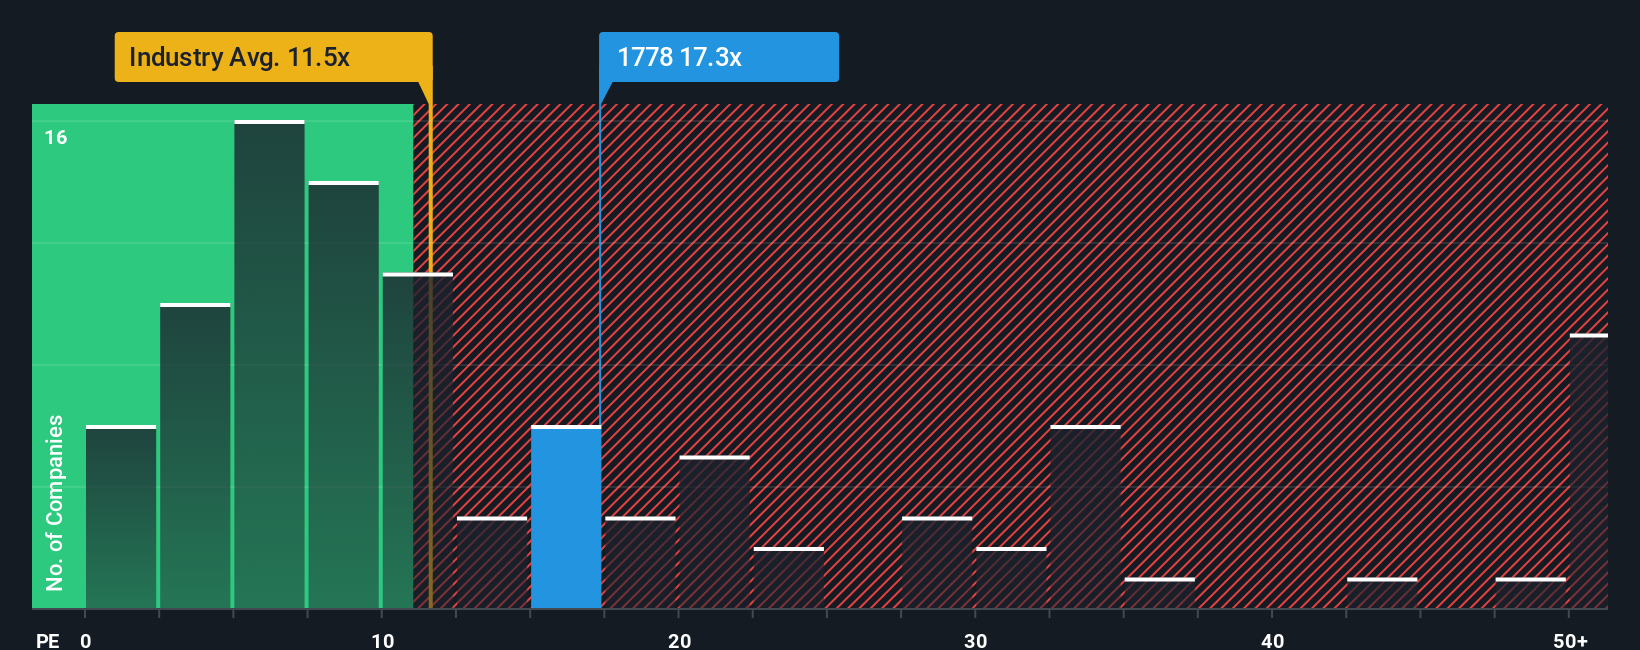
Colour Life Services Group Co., Limited's (HKG:1778) price-to-earnings (or "P/E") ratio of 17.3x might make it look like a sell right now compared to the market in Hong Kong, where around half of the companies have P/E ratios below 11x and even P/E's below 7x are quite common. Nonetheless, we'd need to dig a little deeper to determine if there is a rational basis for the elevated P/E.
We've found 21 US stocks that are forecast to pay a dividend yield of over 6% next year. See the full list for free.
For instance, Colour Life Services Group's receding earnings in recent times would have to be some food for thought. One possibility is that the P/E is high because investors think the company will still do enough to outperform the broader market in the near future. You'd really hope so, otherwise you're paying a pretty hefty price for no particular reason.
View our latest analysis for Colour Life Services Group
What Are Growth Metrics Telling Us About The High P/E?
There's an inherent assumption that a company should outperform the market for P/E ratios like Colour Life Services Group's to be considered reasonable.
Retrospectively, the last year delivered a frustrating 18% decrease to the company's bottom line. This means it has also seen a slide in earnings over the longer-term as EPS is down 14% in total over the last three years. Accordingly, shareholders would have felt downbeat about the medium-term rates of earnings growth.
In contrast to the company, the rest of the market is expected to grow by 19% over the next year, which really puts the company's recent medium-term earnings decline into perspective.
In light of this, it's alarming that Colour Life Services Group's P/E sits above the majority of other companies. It seems most investors are ignoring the recent poor growth rate and are hoping for a turnaround in the company's business prospects. There's a very good chance existing shareholders are setting themselves up for future disappointment if the P/E falls to levels more in line with the recent negative growth rates.
The Final Word
Typically, we'd caution against reading too much into price-to-earnings ratios when settling on investment decisions, though it can reveal plenty about what other market participants think about the company.
We've established that Colour Life Services Group currently trades on a much higher than expected P/E since its recent earnings have been in decline over the medium-term. When we see earnings heading backwards and underperforming the market forecasts, we suspect the share price is at risk of declining, sending the high P/E lower. Unless the recent medium-term conditions improve markedly, it's very challenging to accept these prices as being reasonable.
We don't want to rain on the parade too much, but we did also find 5 warning signs for Colour Life Services Group (1 is potentially serious!) that you need to be mindful of.
You might be able to find a better investment than Colour Life Services Group. If you want a selection of possible candidates, check out this free list of interesting companies that trade on a low P/E (but have proven they can grow earnings).
New: AI Stock Screener & Alerts
Our new AI Stock Screener scans the market every day to uncover opportunities.
• Dividend Powerhouses (3%+ Yield)• Undervalued Small Caps with Insider Buying• High growth Tech and AI CompaniesOr build your own from over 50 metrics.
Explore Now for FreeHave feedback on this article? Concerned about the content? Get in touch with us directly. Alternatively, email editorial-team (at) simplywallst.com.This article by Simply Wall St is general in nature. We provide commentary based on historical data and analyst forecasts only using an unbiased methodology and our articles are not intended to be financial advice. It does not constitute a recommendation to buy or sell any stock, and does not take account of your objectives, or your financial situation. We aim to bring you long-term focused analysis driven by fundamental data. Note that our analysis may not factor in the latest price-sensitive company announcements or qualitative material. Simply Wall St has no position in any stocks mentioned.
Disclaimer: Investing carries risk. This is not financial advice. The above content should not be regarded as an offer, recommendation, or solicitation on acquiring or disposing of any financial products, any associated discussions, comments, or posts by author or other users should not be considered as such either. It is solely for general information purpose only, which does not consider your own investment objectives, financial situations or needs. TTM assumes no responsibility or warranty for the accuracy and completeness of the information, investors should do their own research and may seek professional advice before investing.
Most Discussed
- 1
- 2
- 3
- 4
- 5
- 6
- 7
- 8
- 9
- 10