Market Might Still Lack Some Conviction On Sin Heng Heavy Machinery Limited (SGX:BKA) Even After 33% Share Price Boost
Sin Heng Heavy Machinery Limited (SGX:BKA) shareholders have had their patience rewarded with a 33% share price jump in the last month. Looking back a bit further, it's encouraging to see the stock is up 55% in the last year.
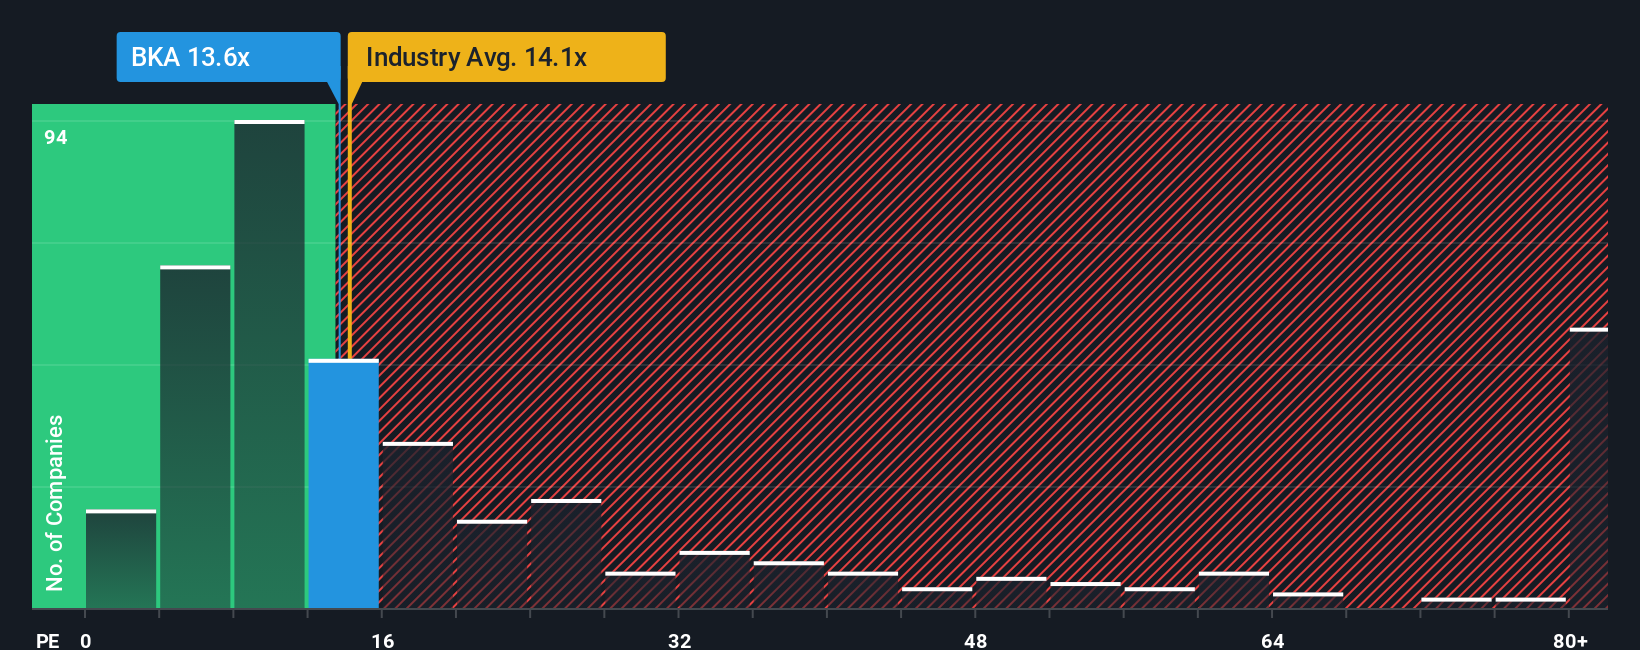
Even after such a large jump in price, it's still not a stretch to say that Sin Heng Heavy Machinery's price-to-earnings (or "P/E") ratio of 13.6x right now seems quite "middle-of-the-road" compared to the market in Singapore, where the median P/E ratio is around 13x. However, investors might be overlooking a clear opportunity or potential setback if there is no rational basis for the P/E.
AI is about to change healthcare. These 20 stocks are working on everything from early diagnostics to drug discovery. The best part - they are all under $10bn in marketcap - there is still time to get in early.
For example, consider that Sin Heng Heavy Machinery's financial performance has been poor lately as its earnings have been in decline. One possibility is that the P/E is moderate because investors think the company might still do enough to be in line with the broader market in the near future. If you like the company, you'd at least be hoping this is the case so that you could potentially pick up some stock while it's not quite in favour.
Check out our latest analysis for Sin Heng Heavy Machinery
Does Growth Match The P/E?
There's an inherent assumption that a company should be matching the market for P/E ratios like Sin Heng Heavy Machinery's to be considered reasonable.
Taking a look back first, the company's earnings per share growth last year wasn't something to get excited about as it posted a disappointing decline of 19%. Even so, admirably EPS has lifted 74% in aggregate from three years ago, notwithstanding the last 12 months. So we can start by confirming that the company has generally done a very good job of growing earnings over that time, even though it had some hiccups along the way.
Comparing that to the market, which is only predicted to deliver 12% growth in the next 12 months, the company's momentum is stronger based on recent medium-term annualised earnings results.
With this information, we find it interesting that Sin Heng Heavy Machinery is trading at a fairly similar P/E to the market. Apparently some shareholders believe the recent performance is at its limits and have been accepting lower selling prices.
The Final Word
Its shares have lifted substantially and now Sin Heng Heavy Machinery's P/E is also back up to the market median. It's argued the price-to-earnings ratio is an inferior measure of value within certain industries, but it can be a powerful business sentiment indicator.
Our examination of Sin Heng Heavy Machinery revealed its three-year earnings trends aren't contributing to its P/E as much as we would have predicted, given they look better than current market expectations. When we see strong earnings with faster-than-market growth, we assume potential risks are what might be placing pressure on the P/E ratio. At least the risk of a price drop looks to be subdued if recent medium-term earnings trends continue, but investors seem to think future earnings could see some volatility.
Don't forget that there may be other risks. For instance, we've identified 2 warning signs for Sin Heng Heavy Machinery that you should be aware of.
You might be able to find a better investment than Sin Heng Heavy Machinery. If you want a selection of possible candidates, check out this free list of interesting companies that trade on a low P/E (but have proven they can grow earnings).
New: Manage All Your Stock Portfolios in One Place
We've created the ultimate portfolio companion for stock investors, and it's free.
• Connect an unlimited number of Portfolios and see your total in one currency• Be alerted to new Warning Signs or Risks via email or mobile• Track the Fair Value of your stocks
Try a Demo Portfolio for FreeHave feedback on this article? Concerned about the content? Get in touch with us directly. Alternatively, email editorial-team (at) simplywallst.com.This article by Simply Wall St is general in nature. We provide commentary based on historical data and analyst forecasts only using an unbiased methodology and our articles are not intended to be financial advice. It does not constitute a recommendation to buy or sell any stock, and does not take account of your objectives, or your financial situation. We aim to bring you long-term focused analysis driven by fundamental data. Note that our analysis may not factor in the latest price-sensitive company announcements or qualitative material. Simply Wall St has no position in any stocks mentioned.
Disclaimer: Investing carries risk. This is not financial advice. The above content should not be regarded as an offer, recommendation, or solicitation on acquiring or disposing of any financial products, any associated discussions, comments, or posts by author or other users should not be considered as such either. It is solely for general information purpose only, which does not consider your own investment objectives, financial situations or needs. TTM assumes no responsibility or warranty for the accuracy and completeness of the information, investors should do their own research and may seek professional advice before investing.
Most Discussed
- 1
- 2
- 3
- 4
- 5
- 6
- 7
- 8
- 9
- 10