Are Robust Financials Driving The Recent Rally In Zhejiang Expressway Co., Ltd.'s (HKG:576) Stock?
Zhejiang Expressway's (HKG:576) stock is up by a considerable 24% over the past three months. Given that the market rewards strong financials in the long-term, we wonder if that is the case in this instance. Particularly, we will be paying attention to Zhejiang Expressway's ROE today.
Return on equity or ROE is an important factor to be considered by a shareholder because it tells them how effectively their capital is being reinvested. Put another way, it reveals the company's success at turning shareholder investments into profits.
We've found 21 US stocks that are forecast to pay a dividend yield of over 6% next year. See the full list for free.
How To Calculate Return On Equity?
Return on equity can be calculated by using the formula:
Return on Equity = Net Profit (from continuing operations) ÷ Shareholders' Equity
So, based on the above formula, the ROE for Zhejiang Expressway is:
9.8% = CN¥7.4b ÷ CN¥75b (Based on the trailing twelve months to March 2025).
The 'return' is the yearly profit. That means that for every HK$1 worth of shareholders' equity, the company generated HK$0.10 in profit.
See our latest analysis for Zhejiang Expressway
Why Is ROE Important For Earnings Growth?
So far, we've learned that ROE is a measure of a company's profitability. We now need to evaluate how much profit the company reinvests or "retains" for future growth which then gives us an idea about the growth potential of the company. Generally speaking, other things being equal, firms with a high return on equity and profit retention, have a higher growth rate than firms that don’t share these attributes.
Zhejiang Expressway's Earnings Growth And 9.8% ROE
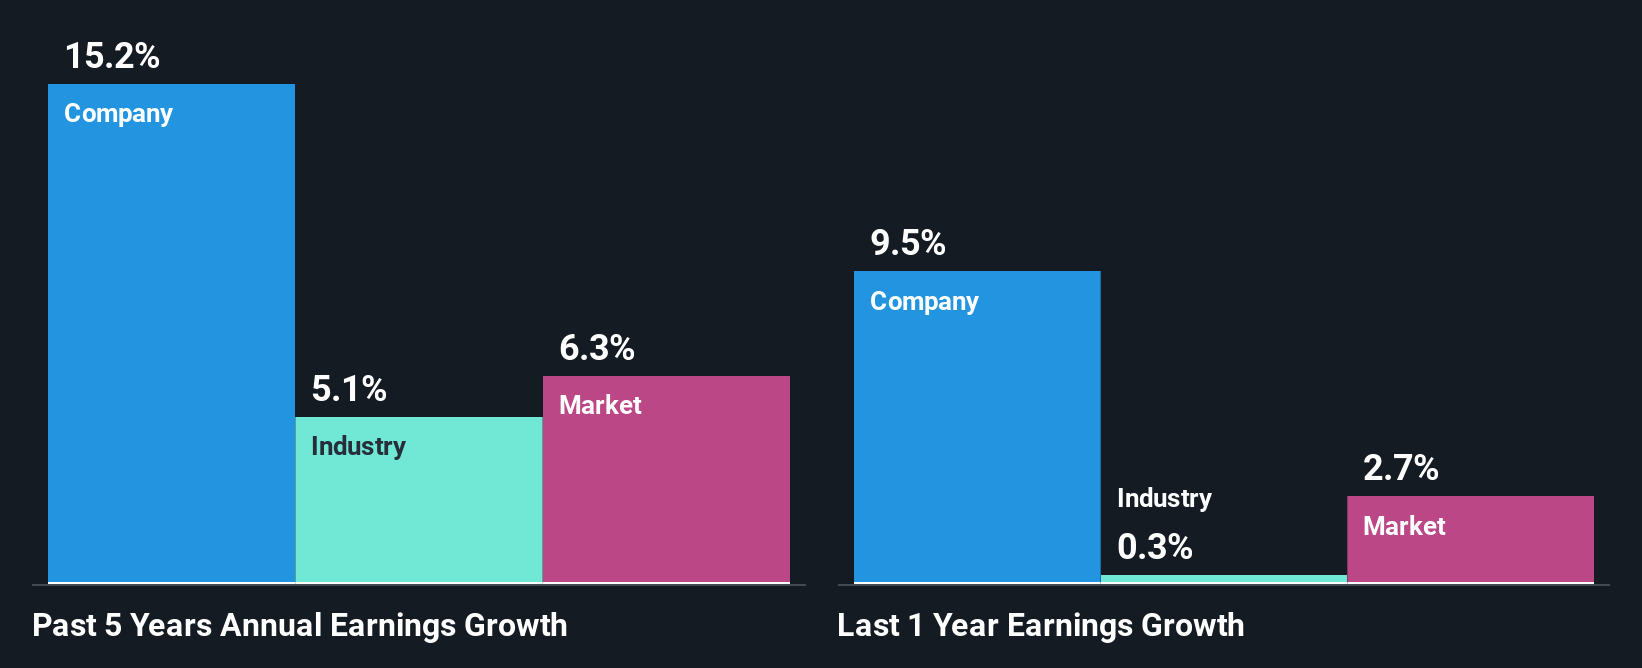
On the face of it, Zhejiang Expressway's ROE is not much to talk about. However, the fact that the company's ROE is higher than the average industry ROE of 7.6%, is definitely interesting. This probably goes some way in explaining Zhejiang Expressway's moderate 15% growth over the past five years amongst other factors. Bear in mind, the company does have a moderately low ROE. It is just that the industry ROE is lower. So there might well be other reasons for the earnings to grow. Such as- high earnings retention or the company belonging to a high growth industry.
We then compared Zhejiang Expressway's net income growth with the industry and we're pleased to see that the company's growth figure is higher when compared with the industry which has a growth rate of 5.1% in the same 5-year period.
The basis for attaching value to a company is, to a great extent, tied to its earnings growth. It’s important for an investor to know whether the market has priced in the company's expected earnings growth (or decline). This then helps them determine if the stock is placed for a bright or bleak future. What is 576 worth today? The intrinsic value infographic in our free research report helps visualize whether 576 is currently mispriced by the market.
Is Zhejiang Expressway Using Its Retained Earnings Effectively?
Zhejiang Expressway has a healthy combination of a moderate three-year median payout ratio of 33% (or a retention ratio of 67%) and a respectable amount of growth in earnings as we saw above, meaning that the company has been making efficient use of its profits.
Additionally, Zhejiang Expressway has paid dividends over a period of at least ten years which means that the company is pretty serious about sharing its profits with shareholders. Our latest analyst data shows that the future payout ratio of the company over the next three years is expected to be approximately 38%. As a result, Zhejiang Expressway's ROE is not expected to change by much either, which we inferred from the analyst estimate of 10% for future ROE.
Conclusion
Overall, we are quite pleased with Zhejiang Expressway's performance. Particularly, we like that the company is reinvesting heavily into its business at a moderate rate of return. Unsurprisingly, this has led to an impressive earnings growth. Having said that, the company's earnings growth is expected to slow down, as forecasted in the current analyst estimates. To know more about the latest analysts predictions for the company, check out this visualization of analyst forecasts for the company.
Valuation is complex, but we're here to simplify it.
Discover if Zhejiang Expressway might be undervalued or overvalued with our detailed analysis, featuring fair value estimates, potential risks, dividends, insider trades, and its financial condition.
Access Free AnalysisHave feedback on this article? Concerned about the content? Get in touch with us directly. Alternatively, email editorial-team (at) simplywallst.com.This article by Simply Wall St is general in nature. We provide commentary based on historical data and analyst forecasts only using an unbiased methodology and our articles are not intended to be financial advice. It does not constitute a recommendation to buy or sell any stock, and does not take account of your objectives, or your financial situation. We aim to bring you long-term focused analysis driven by fundamental data. Note that our analysis may not factor in the latest price-sensitive company announcements or qualitative material. Simply Wall St has no position in any stocks mentioned.
Disclaimer: Investing carries risk. This is not financial advice. The above content should not be regarded as an offer, recommendation, or solicitation on acquiring or disposing of any financial products, any associated discussions, comments, or posts by author or other users should not be considered as such either. It is solely for general information purpose only, which does not consider your own investment objectives, financial situations or needs. TTM assumes no responsibility or warranty for the accuracy and completeness of the information, investors should do their own research and may seek professional advice before investing.
Most Discussed
- 1
- 2
- 3
- 4
- 5
- 6
- 7
- 8
- 9
- 10