TradingKey - After a sharp V-shaped recovery in April and choppy gains through May, U.S. stocks accelerated their rally in June despite escalating Middle East tensions. The S&P 500 and Nasdaq Composite hit fresh year-to-date highs, underscoring the market’s resilience.
From the perspective of the ETF market, there was an obvious differentiation between industries in June. Among them, the ETF index representing the technology industry (code: XLK) gained nearly 10% throughout June, while the consumer staples theme ETF (code: XLP) was the only ETF to close in the red by the end of June.
ETF Code | Sectors | Performance(%) |
XLK | Technology | 9.8 |
XLC | Communication | 7.3 |
XLI | Industrial | 3.6 |
XLF | Financial | 3.1 |
XLB | Materials | 2.2 |
XLV | Health Care | 2.1 |
XLY | Consumer Discretionary | 1.9 |
XLP | Consumer Staples | -1.6 |
Performance of ETFs in different industries in June, source: Reuters, TradingKey
It is precisely because of the differentiation in performance among industries that the three major US stock indexes have shown significant differences. The caveat for investors is while investing in ETFs can avoid certain company-specific risks, the real big challenge lies in timing sectors.
Market Outlook
The Fed would not be carrying out preventive rate cuts, as done in the past, but it remains open to adjust to changes. Despite there are major contradictions between Trump and Powell, we believe that July and September are still two very important windows. In the June FOMC meeting, although the Fed still kept the interest rate unchanged, Chairman Powell's speech after the meeting showed a certain change in attitude (towards dovishness), believing that the next interest rate cut will be considered when employment and inflation data show a significant deterioration.
In fact, most of the US economic data have significantly worsened, and this is not just due to Trump's radical tariff policy. Uncertain tariff path has led to preemptive stockpiling, advancing consumer demands while whitewashing short-term economic data.
The latest data reveals a contraction in June's ADP Employment figures — marking only the second such decline since the pandemic. The previous instance coincided with the collapse of Silicon Valley Bank, which prompted the Federal Reserve to inject emergency liquidity into the banking system. Coincidentally, U.S. personal consumption expenditures are also accelerating their downward trajectory, with growth sliding to the slowest pace in over three years. This trend cannot be solely attributed to April's tariff policies.
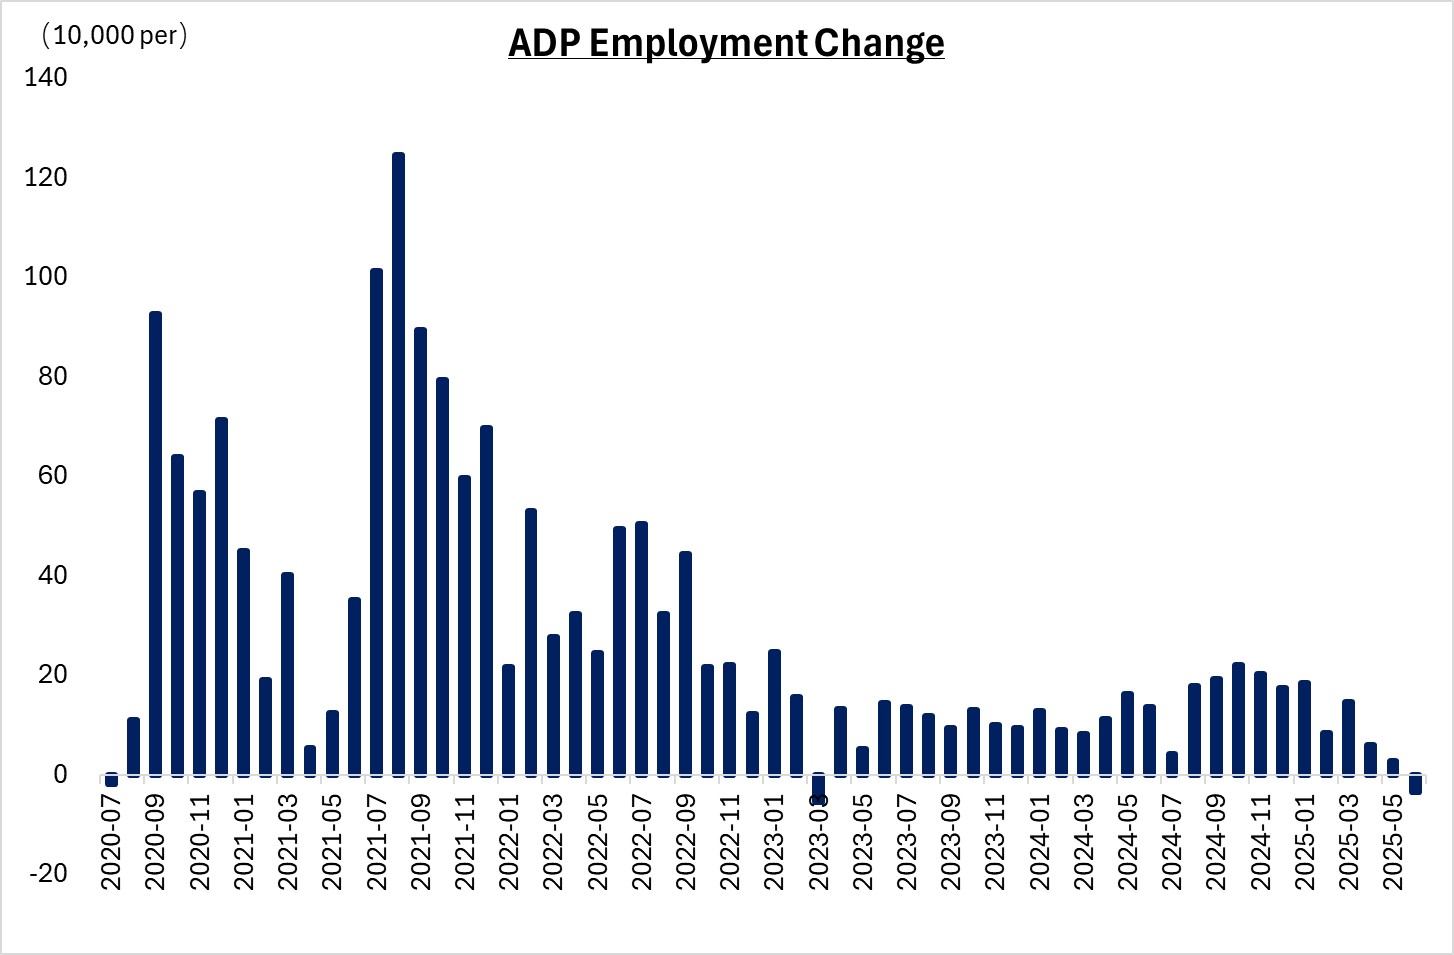
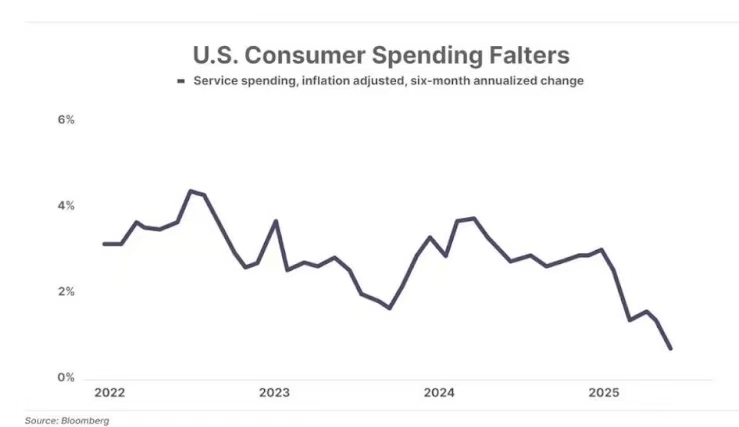
Data Sources: Bloomberg, TradingKey As of: July 2, 2025
Federal Reserve Chair Jerome Powell asserted on July 2 that the Fed would have already cut rates "had it not been for the Trump-era tariff policies". This underscores that despite inflation risks, the Fed prioritizes combating economic deterioration and labor-market weakness. While a July rate cut remains possible, a September move is highly probable—potentially including a 50-basis-point reduction.
Therefore, based on our judgment of subsequent market trends and the specific holdings information of relevant ETFs, we have selected three investment directions and corresponding ETFs as ETFs worth buying by investors in July 2025!
Aggressive Investment
For growth-oriented portfolios, technology equities offer compelling exposure. Beyond the momentum from ChatGPT-driven AI enthusiasm, the sector’s dominance stems from high-end computing chips — a foundational competitive moat enabling near-monopolistic advantages. Long-term investors betting on AI’s societal and economic transformation will find this allocation well justified.
Catalysts Ahead:
- Lower Rates Boost Growth Stocks: A Fed easing cycle disproportionately benefits growth-oriented equities.
- Regulatory Tailwinds: The proposed Great America Act could slash corporate taxes for tech firms, directly lifting earnings and valuations.
We highlight three top-performing tech ETFs — all outpacing the S&P 500 and Nasdaq over five years:
ETF | Ticker | Key Holdings & Differentiation | 5-Yr Return |
SMH | 20% weight in NVIDIA; 71.6% top-10 concentration → highest returns | #1 | |
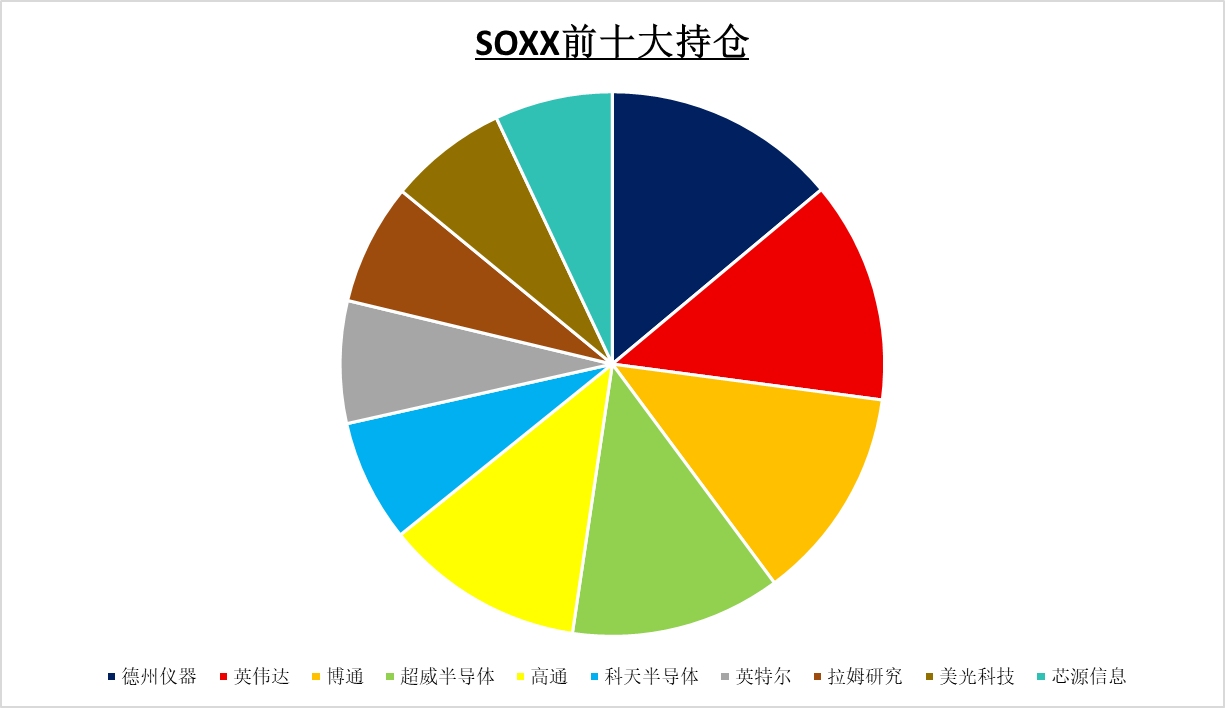
iShares PHLX Semiconductor ETF | SOXX | Pure-play chip exposure (100% top 10 in semis); ~59% top-10 concentration | #2 |
VGT | Broader mega-cap tech (Apple, Microsoft); ~59% top-10 concentration | #3 |
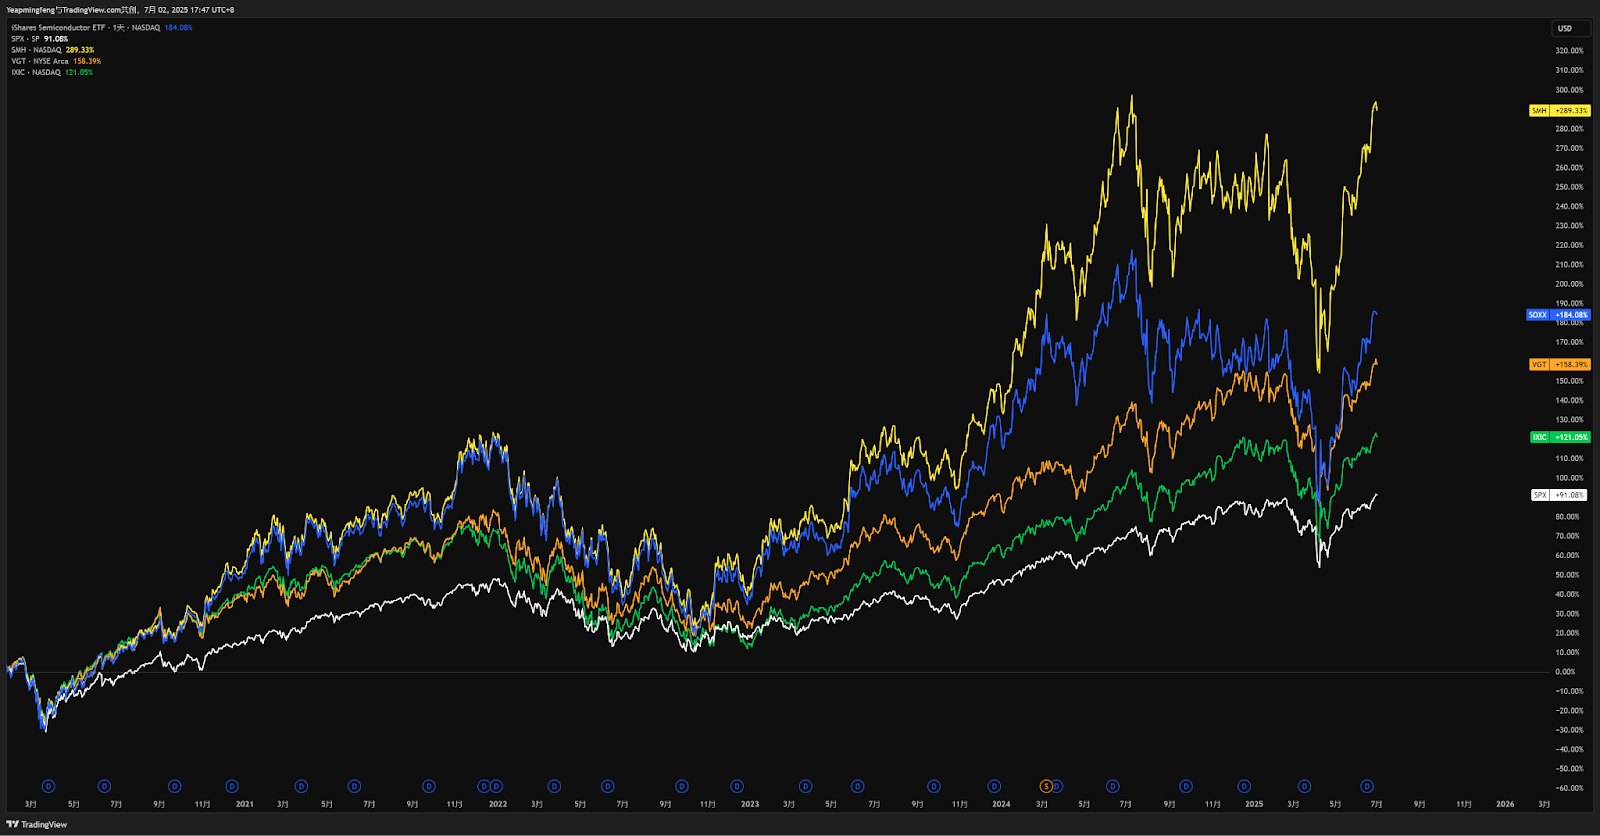
Data Sources: Reuters, TradingView, TradingKey As of: July 2, 2025
SMH’s outsized NVIDIA bet fueled its lead, while SOXX offers focused semiconductor exposure. VGT provides diversified tech access but with lower AI/chip intensity. Investors should align selections with risk tolerance: concentrated bets (SMH) vs. broader diversification (VGT).
Conservative Investment
For Risk-Averse Investors, Cash Flow & Dividend ETFs Offer Stability
Investors seeking lower volatility exposure may consider dividend-focused or free-cash-flow-themed ETFs. The Pacer US Cash Cows 100 ETF (COWZ) targets the top 100 U.S. companies ranked by free cash flow yield, while the Schwab US Dividend Equity ETF (SCHD) employs a four-factor screening model — cash flow to total debt, return on equity, dividend yield, and 5-year dividend growth — to select 100 high-yield firms with over a decade of consecutive payouts.
COWZ’s methodology prioritizes Free Cash Flow for the Firm (FCFF) — a metric capturing residual cash after operating expenses, taxes, and working capital adjustments. This screens for financially robust "cash cows" capable of sustaining operations and profitability through economic downturns. Shareholders receive net dividends after expense deductions.
Unlike thematic ETFs, both strategies exhibit balanced sector exposure:
- SCHD: Largest weightings in Health Care (25.1%), Financials (20.3%), and Consumer Staples (18.7%).
- COWZ: Focused on Information Technology (31.2%), Health Care (19.5%), and Energy (15.8%) — sectors with persistent cash flow generation.
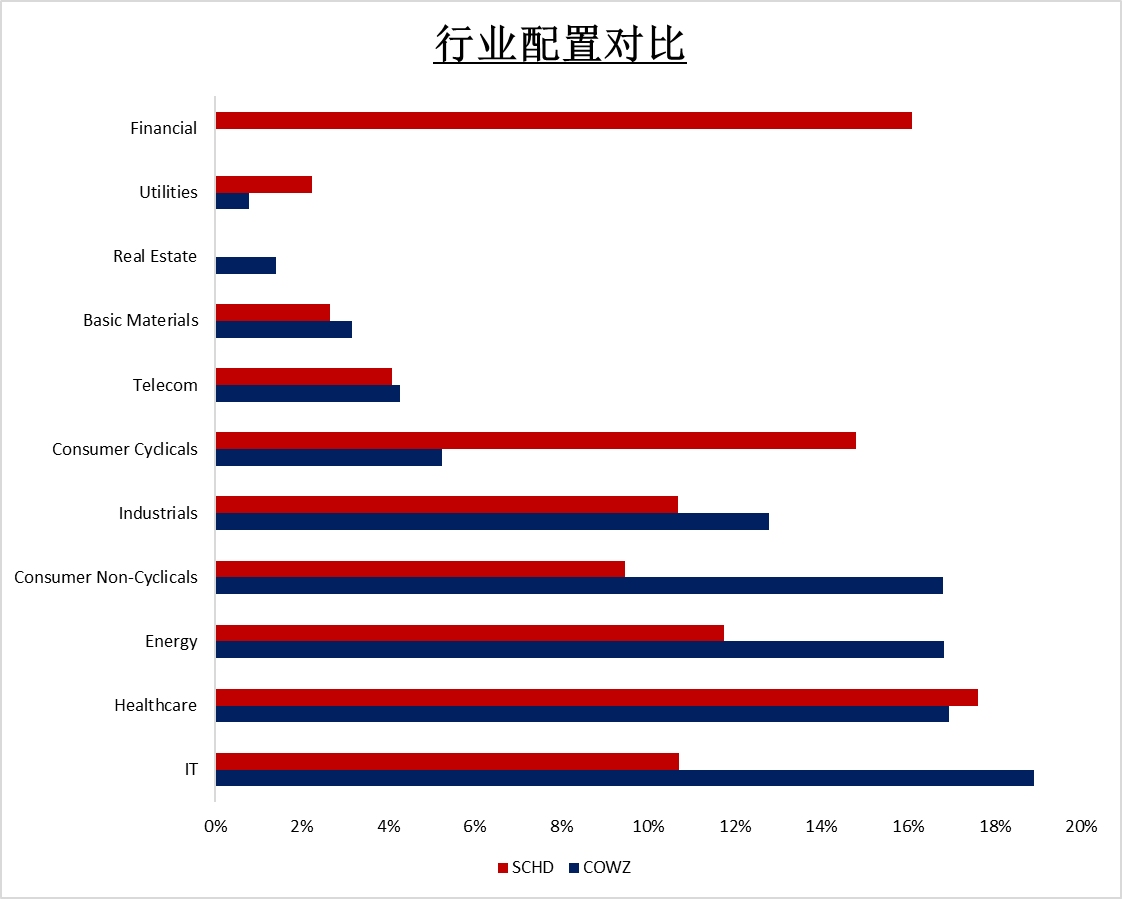
Data Sources: Reuters, TradingKey As of: April 30, 2025
Monetary Policy Tailwinds
These ETFs historically outperform during Federal Reserve rate-cutting cycles or prolonged low-rate regimes. As the Effective Federal Funds Rate (EFFR) declines, demand surges for assets with stable cash flows and high dividend yields. Simultaneously, constituent firms leverage buybacks and dividend hikes to boost shareholder returns. (Note: White line in chart indicates EFFR.)
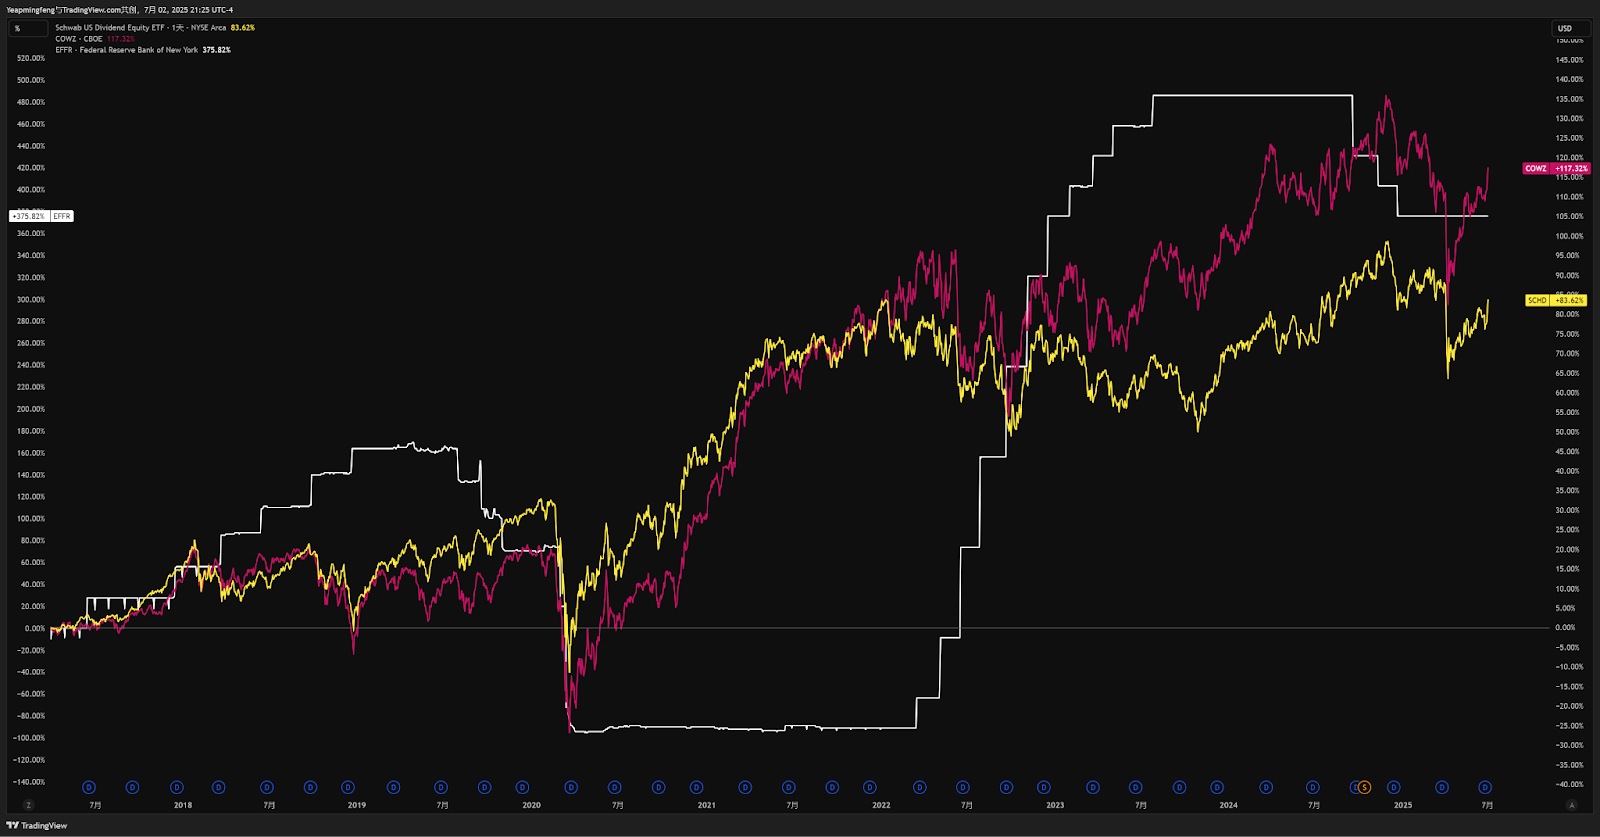
Data Sources: TradingView, TradingKey As of: July 2, 2025
Strategic Investment
Beyond aggressive and conservative positioning, we advocate commodities as a core thematic allocation for July(referred to United States Copper Index Fund (CPER) and SPDR S&P Metals & Mining ETF (XME)). As detailed in our market outlook, the Federal Reserve’s initiation of a new rate-cutting cycle by year-end remains highly probable. Monetary easing typically catalyzes currency depreciation and elevated inflation expectations — both tailwinds for broad-based commodities.
Concurrently, the potential enactment of the One Big Beautiful Bill Act (OBBBA) —recently passed by the House — would inject fiscal stimulus into U.S. infrastructure and industrial production. This legislation mandates substantial government funding for physical assets, directly amplifying procurement demand for industrial metals, notably copper and aluminum.
Find out more