Why Investors Shouldn't Be Surprised By Ultragenyx Pharmaceutical Inc.'s (NASDAQ:RARE) Low P/S
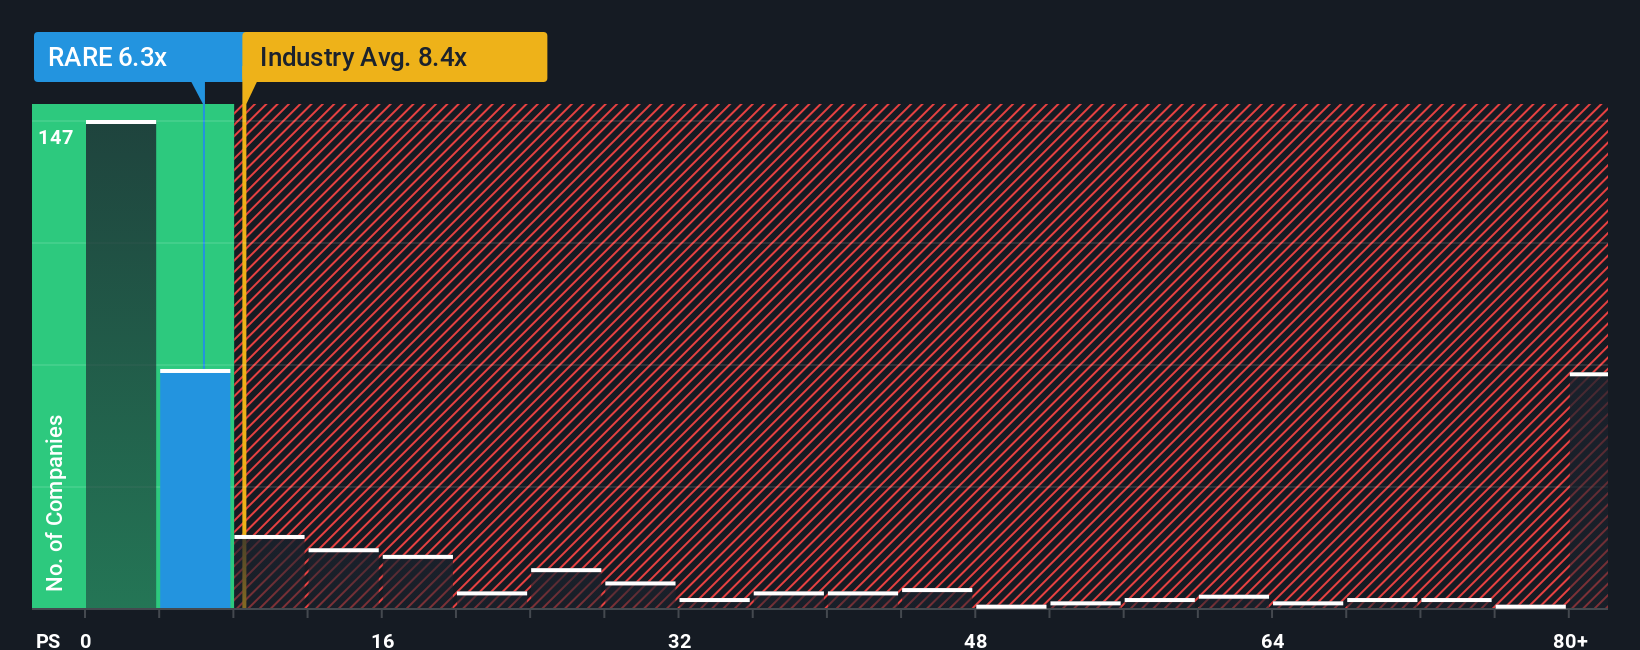
You may think that with a price-to-sales (or "P/S") ratio of 6.3x Ultragenyx Pharmaceutical Inc. (NASDAQ:RARE) is a stock worth checking out, seeing as almost half of all the Biotechs companies in the United States have P/S ratios greater than 8.4x and even P/S higher than 54x aren't out of the ordinary. Nonetheless, we'd need to dig a little deeper to determine if there is a rational basis for the reduced P/S.
AI is about to change healthcare. These 20 stocks are working on everything from early diagnostics to drug discovery. The best part - they are all under $10bn in marketcap - there is still time to get in early.
Check out our latest analysis for Ultragenyx Pharmaceutical
How Ultragenyx Pharmaceutical Has Been Performing
With revenue growth that's inferior to most other companies of late, Ultragenyx Pharmaceutical has been relatively sluggish. It seems that many are expecting the uninspiring revenue performance to persist, which has repressed the growth of the P/S ratio. If you still like the company, you'd be hoping revenue doesn't get any worse and that you could pick up some stock while it's out of favour.
If you'd like to see what analysts are forecasting going forward, you should check out our free report on Ultragenyx Pharmaceutical.Is There Any Revenue Growth Forecasted For Ultragenyx Pharmaceutical?
In order to justify its P/S ratio, Ultragenyx Pharmaceutical would need to produce sluggish growth that's trailing the industry.
If we review the last year of revenue growth, the company posted a terrific increase of 33%. Pleasingly, revenue has also lifted 78% in aggregate from three years ago, thanks to the last 12 months of growth. Accordingly, shareholders would have definitely welcomed those medium-term rates of revenue growth.
Looking ahead now, revenue is anticipated to climb by 32% each year during the coming three years according to the analysts following the company. Meanwhile, the rest of the industry is forecast to expand by 102% per year, which is noticeably more attractive.
With this information, we can see why Ultragenyx Pharmaceutical is trading at a P/S lower than the industry. Apparently many shareholders weren't comfortable holding on while the company is potentially eyeing a less prosperous future.
The Bottom Line On Ultragenyx Pharmaceutical's P/S
Generally, our preference is to limit the use of the price-to-sales ratio to establishing what the market thinks about the overall health of a company.
We've established that Ultragenyx Pharmaceutical maintains its low P/S on the weakness of its forecast growth being lower than the wider industry, as expected. Shareholders' pessimism on the revenue prospects for the company seems to be the main contributor to the depressed P/S. Unless these conditions improve, they will continue to form a barrier for the share price around these levels.
A lot of potential risks can sit within a company's balance sheet. Our free balance sheet analysis for Ultragenyx Pharmaceutical with six simple checks will allow you to discover any risks that could be an issue.
It's important to make sure you look for a great company, not just the first idea you come across. So if growing profitability aligns with your idea of a great company, take a peek at this free list of interesting companies with strong recent earnings growth (and a low P/E).
New: AI Stock Screener & Alerts
Our new AI Stock Screener scans the market every day to uncover opportunities.
• Dividend Powerhouses (3%+ Yield)• Undervalued Small Caps with Insider Buying• High growth Tech and AI CompaniesOr build your own from over 50 metrics.
Explore Now for FreeHave feedback on this article? Concerned about the content? Get in touch with us directly. Alternatively, email editorial-team (at) simplywallst.com.This article by Simply Wall St is general in nature. We provide commentary based on historical data and analyst forecasts only using an unbiased methodology and our articles are not intended to be financial advice. It does not constitute a recommendation to buy or sell any stock, and does not take account of your objectives, or your financial situation. We aim to bring you long-term focused analysis driven by fundamental data. Note that our analysis may not factor in the latest price-sensitive company announcements or qualitative material. Simply Wall St has no position in any stocks mentioned.
Disclaimer: Investing carries risk. This is not financial advice. The above content should not be regarded as an offer, recommendation, or solicitation on acquiring or disposing of any financial products, any associated discussions, comments, or posts by author or other users should not be considered as such either. It is solely for general information purpose only, which does not consider your own investment objectives, financial situations or needs. TTM assumes no responsibility or warranty for the accuracy and completeness of the information, investors should do their own research and may seek professional advice before investing.
Most Discussed
- 1
- 2
- 3
- 4
- 5
- 6
- 7
- 8
- 9
- 10