Long-Term Holders Realized Profit Upon Bitcoin's All-Time High, Triggering a "Top Capitulation" Signal?
Original Title: Seasoned Holders Taking Profit
Original Author: Glassnode
Original Translator: Felix, PANews
As long-term holders began to take profit, Bitcoin started to retrace after reaching a new high of $111,800. Key support levels are at $103,700 and $95,600, with signs indicating long-term investors selling off, putting the bulls under significant pressure.
Key Points:
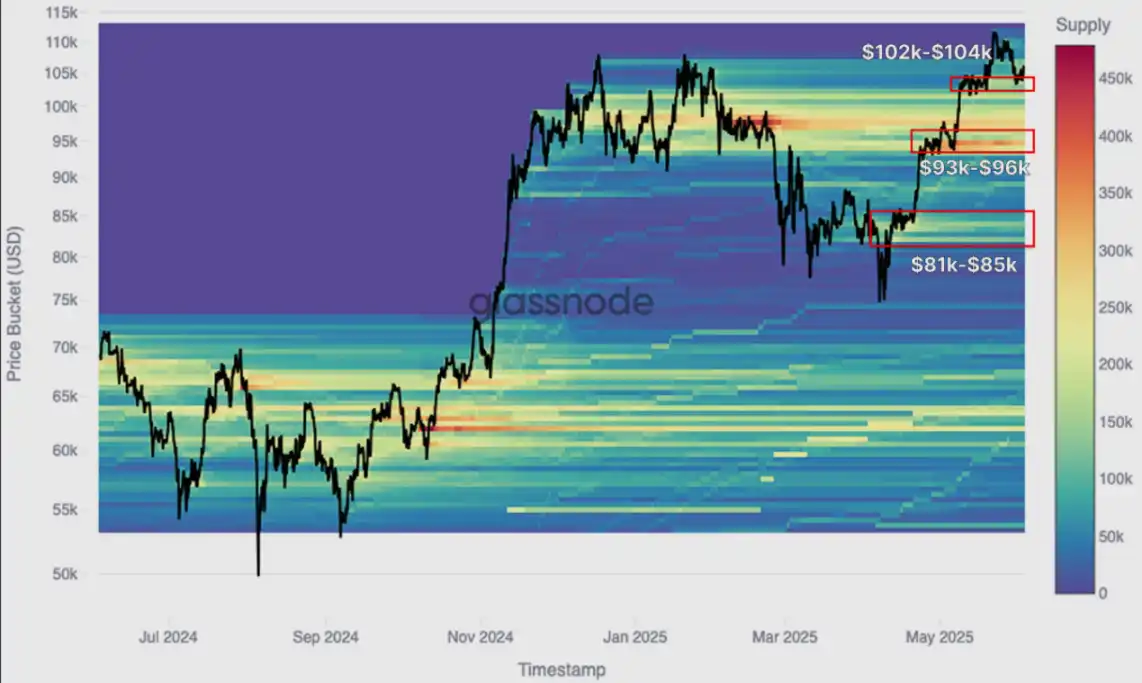
Bitcoin reached a historical high of $111,800 but quickly dropped back to $103,200. The initial surge seemed to be driven by the spot market, with key accumulation zones at $81,000 to $85,000, $93,000 to $96,000, and $102,000 to $104,000 now serving as potential support levels.
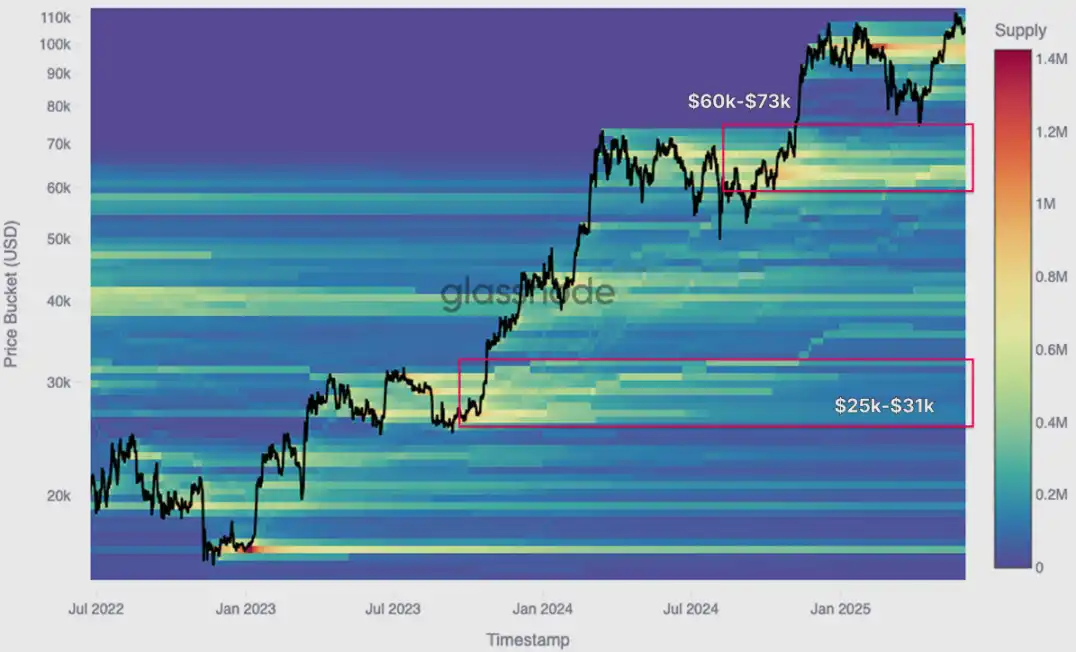
From a more macro perspective, through the CBD heatmap, many historical accumulation zones have turned into sell zones. Sellers from the $25,000 to $31,000, $38,000 to $44,000, and $60,000 to $73,000 ranges are exerting pressure on the price trend.
The cost basis percentile and short-term holder range indicate that recent support levels are near $103,700 and $95,600, with resistance at $114,800. These levels are important statistical indicators of broader market sentiment shifts. Realized profits have surged to $1.47 billion per day, marking the fifth large-scale profit-taking in this cycle. The sell-off is mainly driven by long-term holders rather than short-term traders. The group holding for over a year has dominated the recent sell-off, reflecting mature capital rotation. This is consistent with the previous observations of the CBD heatmap, confirming that seasoned investors are shaping the current top-forming phase.
Upward Trend Staircase Chart
Over the past two weeks, Bitcoin has continued its upward trend, hitting a new high of $111,800, briefly surpassing the previous high set in January 2025. However, it then retraced to $103,200, signaling a possible pause in the bullish momentum. To understand the internal structure of this rebound, the CBD heatmap (PANews Note: The CBD heatmap visualizes Cumulative Volume Delta data in heatmap form) can be used, which can track the net difference between aggressive buying and selling at different price levels. Visually, it can reveal concentrated accumulation or sell regions driven by the spot and assist in identifying price ranges with the strongest demand.
From the heatmap perspective, this rebound is mainly driven by spot trading and shows a stair-step pattern. There are clear accumulation zones in the $81,000 to $85,000 range, $93,000 to $96,000 range, and $102,000 to $104,000 range. These areas could now become supply clusters that, influenced by the overall market sentiment, might provide short-term support.
Notably, the top buyers of this year's first quarter have been holding since the price fell below $80,000. Now, as the price hovers around $110,000, they face another test. This article will explore the recent weakening momentum behind the demand, factors diminishing market strength, and potential support levels if the market continues to be weak.
Source: Glassnode
Long-Term Holder Selling Pressure
To understand the driving force behind Bitcoin's recent breakthrough above $111,000, it is necessary to examine it from a broader market structure perspective. By looking at the heatmap since the June 2022 cycle bottom, the distribution pattern of past accumulated holdings is now becoming clear.
As the price continues to rise, the supply clusters that previously served as accumulation bases (usually characterized by sideways consolidation) have now turned into active selling zones. Visually, the heatmap shows a progressive transition; regions that once supported the upward trend have now become resistance levels as early holders take the opportunity to sell off.
The most significant selling pressure comes from the group of accumulated holders in key historical ranges ($25,000 to $31,000 and $60,000 to $73,000). Many in these groups have gone through multiple volatility stages and are now intensifying the oversupply, seemingly at least temporarily limiting further upside for Bitcoin.
Source: Glassnode
Price Discovery Exploration
As long-term holders gradually exert selling pressure, the possibility of a short-term pullback continues to increase, especially in the absence of robust catalysts to drive Bitcoin firmly above $111,800. In this phase where the bullish momentum stalls, on-chain pricing models become a crucial tool to identify potential support levels during a pullback.
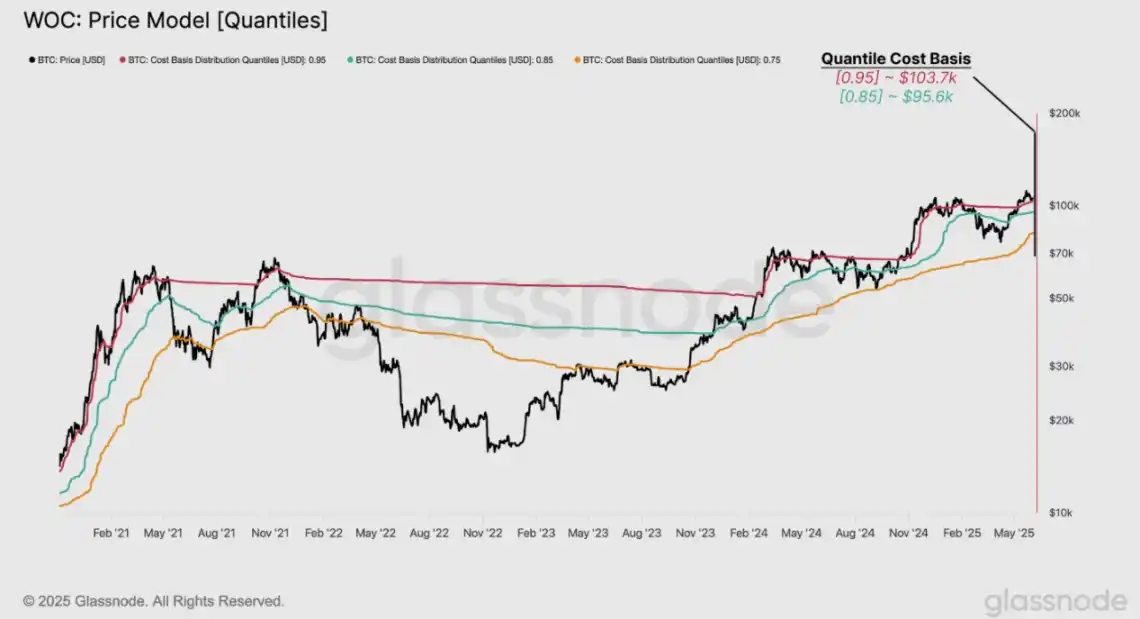
One particularly effective framework is the Spent Supply Distribution (SSD) percentiles. This metric analyzes the cost basis of tokens at a specific time and divides it into 100 percentiles. It provides a high-resolution view of the supply entering the market initially, enabling the identification of areas with higher turnover rates that may be driven by profit-taking or loss realization.
This section focuses on three key percentiles:
· 0.95 (top 5%)
· 0.85 (top 15%)
· 0.75 (top 25%)
Historical patterns over the past five years suggest that when the price is above the 0.95 percentile, there is often a state of absolute euphoria, while a sideways bull market phase usually occurs between 0.85 and 0.95. On the other hand, persistently staying below 0.75 typically marks a bear market or a risk-off period.
Currently, the 0.95 percentile is around $103,700, acting as the first on-chain support level. If selling pressure persists, the next level to watch is the 0.85 percentile at $95,600, which may provide structural support. Alternatively, if this level is breached, it would confirm a broader risk reset.
Source: Glassnode
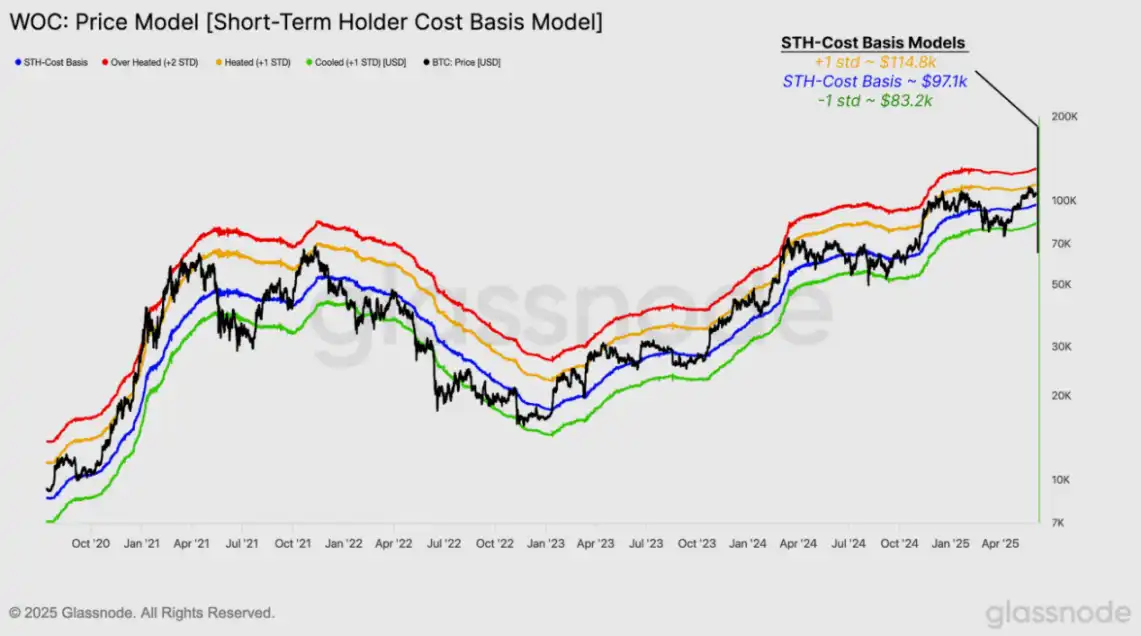
Over the past six months, driven by two all-time highs, a significant amount of Bitcoin supply has changed hands. Therefore, tracking recent investor behavior has become increasingly important. One of the most insightful models is the Short-Term Holder (STH) Cost Basis, which reflects the average purchase price of Bitcoin held for less than 155 days.
To enhance this statistic, a "standard deviation channel" has been applied to this cost basis to define key support and resistance areas. These standard deviation bands help quantify the range of short-term participant market consensus and may signal trend exhaustion or threshold breakthroughs.
Currently, the STH Cost Basis is $97,100, representing the recent buyers' average entry price. +1 is typically associated with overbought or bullish breakout conditions, with its position at $114,800, while -1 is at $83,200, indicating an increased downside risk.
These three levels ($114,800, $97,100, and $83,200) now define the statistical boundaries of short-term market sentiment. Breaking through or falling below these thresholds is likely to determine the next phase of the market, indicating whether momentum is strengthening or weakening.
Source: Glassnode
Profit Realization
As Bitcoin retraced from its recent high of $111,800, most of the selling pressure seemed to come from long-term holders within the current cycle, those who accumulated Bitcoin early in the uptrend and are now realizing significant gains. At this stage, the profit realization mechanism is a key factor in assessing exhaustion risk.
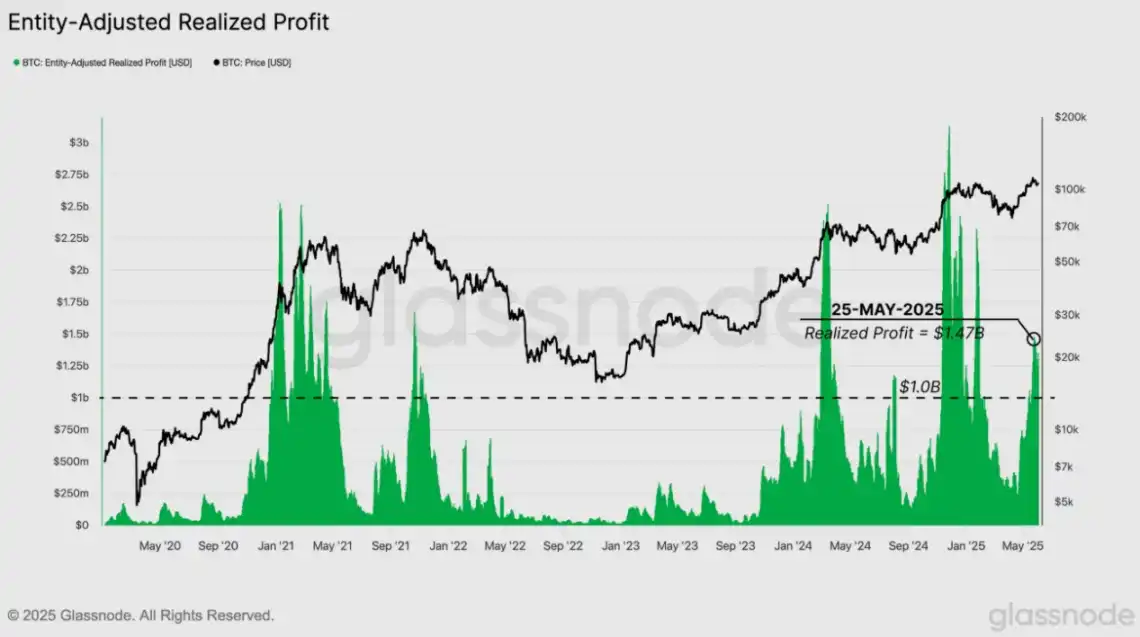
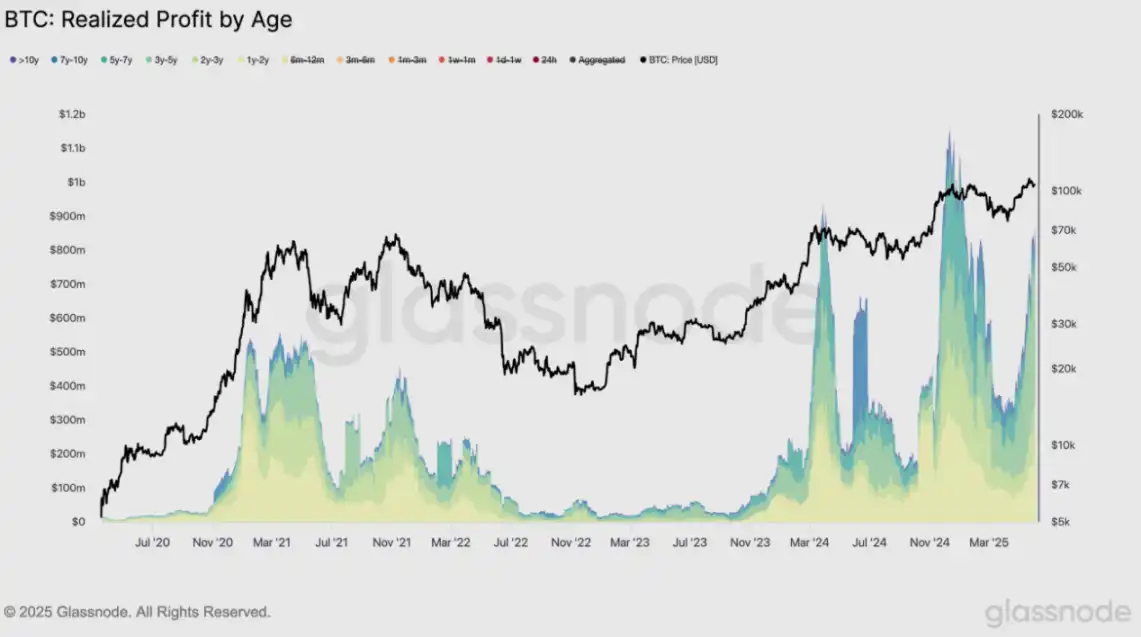
By calculating the 7-day simple moving average of daily on-chain profit realization value (adjusted to exclude intra-entity flows), last week saw a peak of $1.47 billion in daily realized profits. This is a notable level that underscores the intensity of recent capital rotation.
More importantly, this marks the fifth day in this cycle where daily profit-taking exceeded $1 billion. Such events often coincide with local market tops or slowdowns, especially when new demand cannot absorb such a scale of realized gains. This highlights the market's resilience in the face of significant selling pressure.
Source: Glassnode
Dynamic Shift
To better understand the significance of the current wave of profit-taking, it is necessary to examine it from a cyclical perspective. Not all profit-taking events are the same, and the dynamic nature of these mechanisms can reveal how market maturity and volatility shape investor behavior over time.
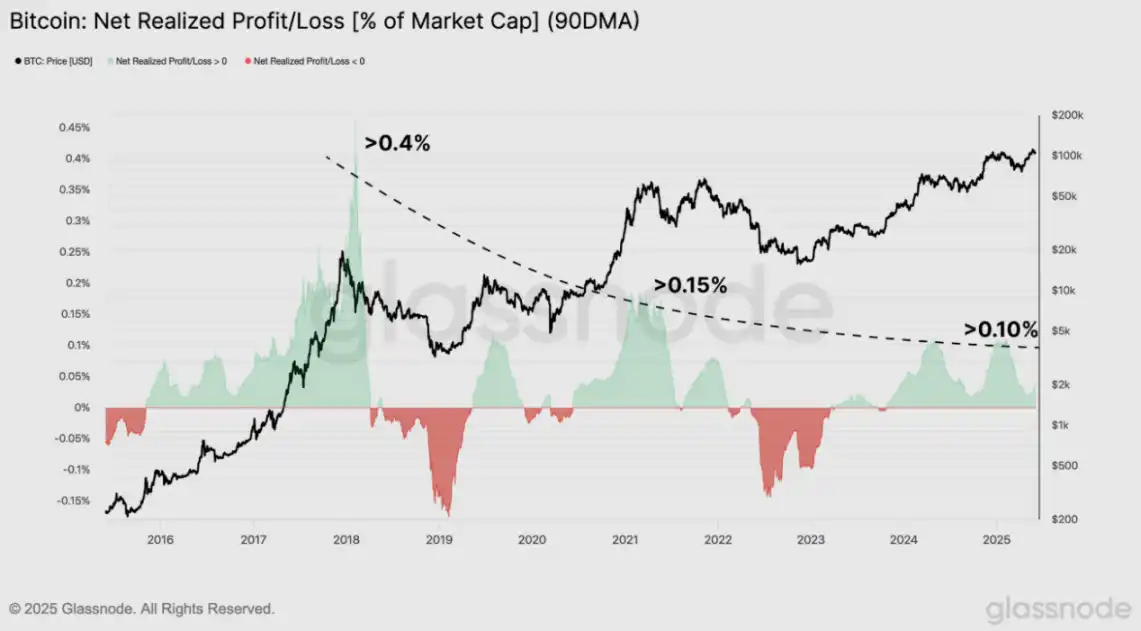
One effective approach is to look at the 90-day simple moving average (SMA) of realized net profit after market value adjustments. This adjustment allows for comparisons across different periods. A clear trend emerges: over time, the enthusiasm for profit-taking has somewhat diminished, reflecting a general degradation of cyclical bullish performance and a reduction in volatility as the market matures.
From November 2015 to April 2018, the net profit-realized phase lasted approximately 25 months, peaking at over 0.4% of the market value. In the 2020 to 2022 cycle, this region lasted about 20 months, but with peaks around only 0.15%. In the current cycle, starting in November 2023, the net profit-realized phase has lasted for 18 months, forming two distinct peaks close to 0.1%.
This trend indicates that while profit-taking still exerts significant pressure, it has become more subdued, possibly heralding a shift from the frenzy of boom and bust to structural capital rotation in a more mature asset class.
Source: Glassnode
Who Is Profiting?
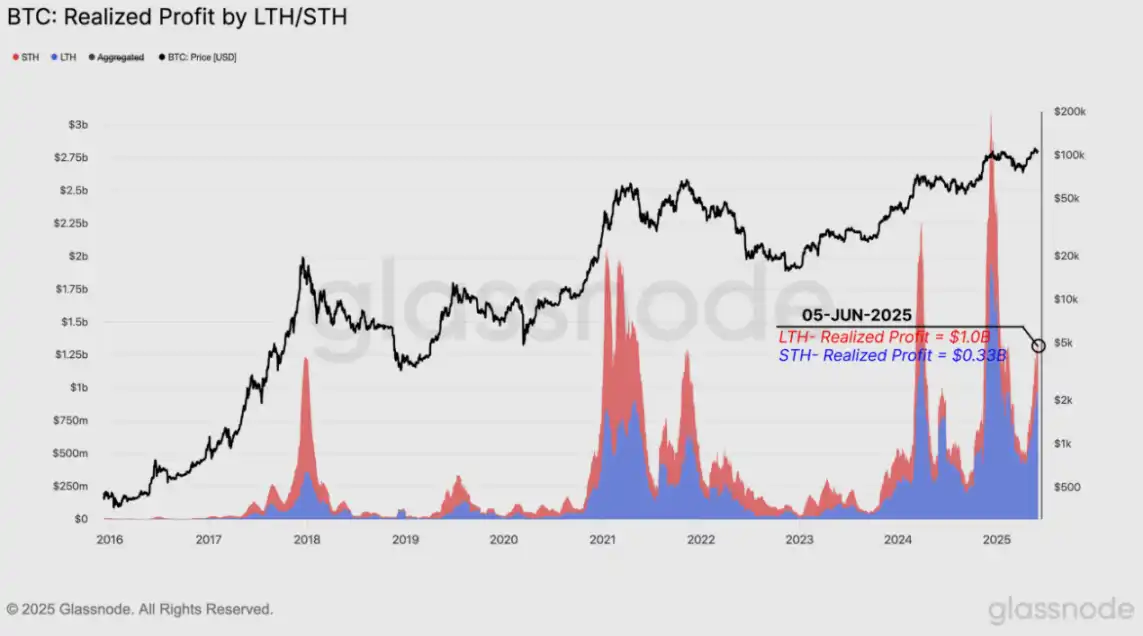
Another perspective on assessing the profit-taking cycle is to determine which investor groups are selling. Since the cycle from 2015 to 2018, at the peak of market frenzy, the profit share realized by Long-Term Holders (LTHs) has steadily increased. This trend highlights a structural shift in market maturity, with more experienced investors driving capital rotation rather than quick-in, quick-out speculators.
During the recent peak period, the 30-day moving average of profit realized by Long-Term Holders (LTHs) has surged to around $1 billion per day, while Short-Term Holders (STHs) have only realized $320 million per day, with the gap between the two exceeding 3 times, further confirming that this round of profit-taking is led by investors with longer holding periods and stronger convictions.
Source: Glassnode
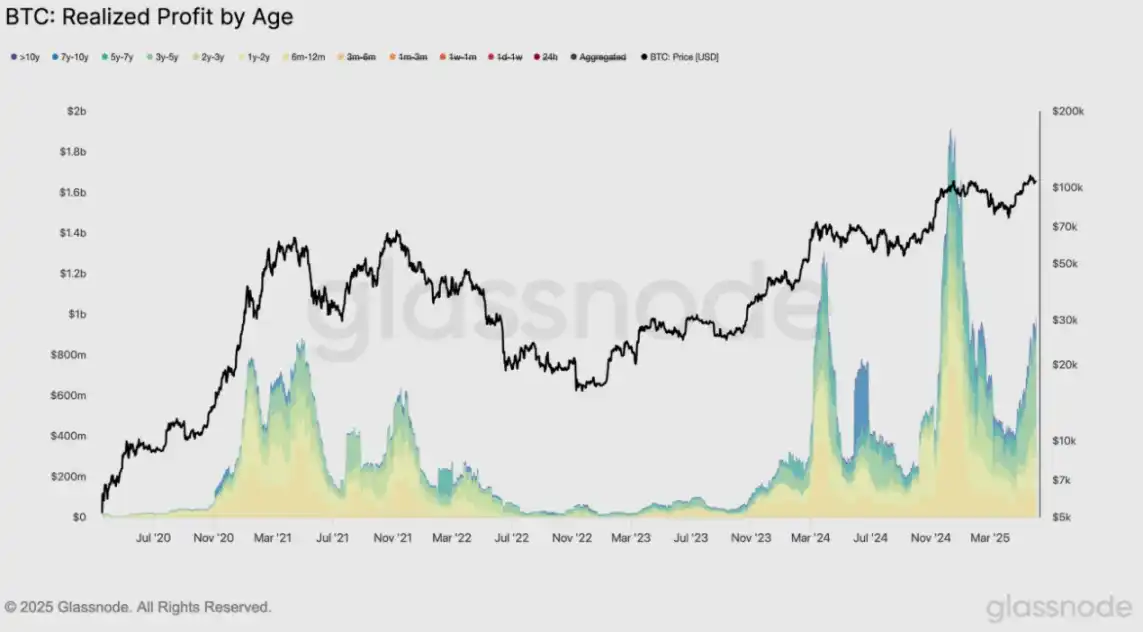
At first glance, the current daily realized profits of Long-Term Holders (holding for over 6 months) of around $1 billion may seem modest compared to the $1.8 billion during the peak in December 2024. However, a deeper analysis reveals a familiar pattern.
In past bull markets, as the cycle progresses, the contribution to profit-taking from investors holding for 6 to 12 months has often been relatively small. This dynamic is once again evident in the current cycle. With the continuation of the uptrend, more seasoned investors among Long-Term Holders are starting to become the primary sellers, shaping the formation of the top of this cycle.
Source: Glassnode
Therefore, by excluding the 6 to 12-month holding group from the total realized profits of Long-Term Holders, we can more accurately assess the true impact of seasoned investors on the current market dynamics. This adjustment eliminates the impact of high-basis 2025 Q1 buyers, whose unrealized gains are relatively limited, and focuses on investors holding for over a year with higher profit margins.
When the profits realized by investors holding for over 1 year are isolated, the significance of this current market trend becomes more apparent. This group is typically associated with HODLers and long-term believers, and now they are taking profits on a large scale, a behavior that often indicates that the bull market trend is maturing or nearing its end.
This observation aligns with the early findings of the heat map, which also indicates that recent selling pressure is primarily coming from seasoned investors, further confirming the notion of increasingly active Long-Term Holders in this top formation phase.
Source: Glassnode
Conclusion
Bitcoin has recently surged to a new all-time high of $111,800, but faces increasing resistance. Market data shows that early buyers are showing signs of exhaustion, with long-term holders taking profits. The heatmaps indicate that several strong accumulation zones have now turned into active sell zones, especially for investors who bought in the $25,000 to $73,000 range.
On-chain pricing models, such as cost basis percentiles and short-term holder statistical ranges, now define the market's immediate structure. If demand weakens, the key support levels at $103,700 and $95,600 will be crucial, while the resistance range at $114,800 remains a test for market recovery.
Profit-taking mechanisms are also showing increasingly intense activity, with daily profit peaks reaching $1.47 billion, primarily driven by long-term holders. This trend, coupled with the rising proportion of profits realized by the over 1-year holding group, suggests that we may be witnessing a distribution phase rather than a new breakout.
Overall, the market appears to be at a crossroads, facing pressures from increased selling, waning bullish momentum, and the need for demand to prove its resilience. The coming weeks will be crucial in determining whether this is a mid-term consolidation phase or the beginning of a broader market top formation.
Original Article Link
Welcome to join the official BlockBeats community:
Telegram Subscription Group: https://t.me/theblockbeats
Telegram Discussion Group: https://t.me/BlockBeats_App
Official Twitter Account: https://twitter.com/BlockBeatsAsia
Disclaimer: Investing carries risk. This is not financial advice. The above content should not be regarded as an offer, recommendation, or solicitation on acquiring or disposing of any financial products, any associated discussions, comments, or posts by author or other users should not be considered as such either. It is solely for general information purpose only, which does not consider your own investment objectives, financial situations or needs. TTM assumes no responsibility or warranty for the accuracy and completeness of the information, investors should do their own research and may seek professional advice before investing.
Most Discussed
- 1
- 2
- 3
- 4
- 5
- 6
- 7
- 8
- 9
- 10