Here's Why Solaris Energy Infrastructure (NYSE:SEI) Has A Meaningful Debt Burden
Howard Marks put it nicely when he said that, rather than worrying about share price volatility, 'The possibility of permanent loss is the risk I worry about... and every practical investor I know worries about.' It's only natural to consider a company's balance sheet when you examine how risky it is, since debt is often involved when a business collapses. We note that Solaris Energy Infrastructure, Inc. (NYSE:SEI) does have debt on its balance sheet. But the real question is whether this debt is making the company risky.
This technology could replace computers: discover the 20 stocks are working to make quantum computing a reality.
When Is Debt A Problem?
Generally speaking, debt only becomes a real problem when a company can't easily pay it off, either by raising capital or with its own cash flow. Part and parcel of capitalism is the process of 'creative destruction' where failed businesses are mercilessly liquidated by their bankers. However, a more usual (but still expensive) situation is where a company must dilute shareholders at a cheap share price simply to get debt under control. Of course, plenty of companies use debt to fund growth, without any negative consequences. The first step when considering a company's debt levels is to consider its cash and debt together.
How Much Debt Does Solaris Energy Infrastructure Carry?
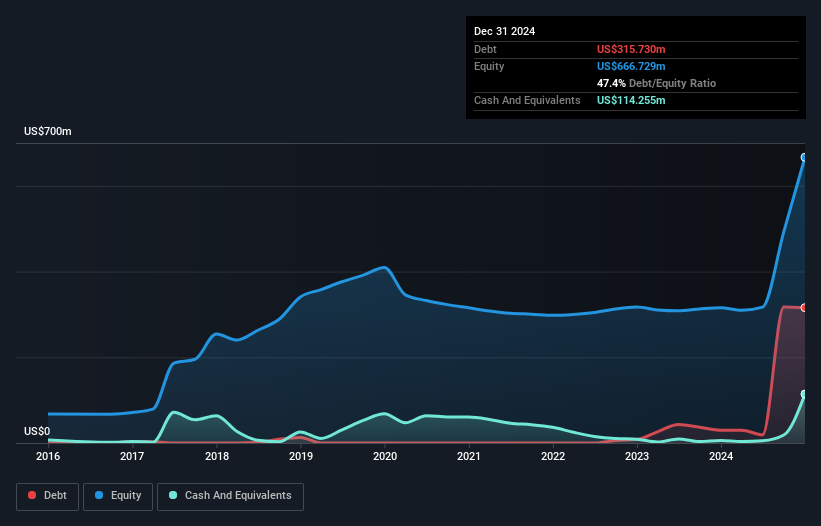
The image below, which you can click on for greater detail, shows that at December 2024 Solaris Energy Infrastructure had debt of US$315.7m, up from US$30.0m in one year. However, it also had US$114.3m in cash, and so its net debt is US$201.5m.
How Strong Is Solaris Energy Infrastructure's Balance Sheet?
According to the last reported balance sheet, Solaris Energy Infrastructure had liabilities of US$65.5m due within 12 months, and liabilities of US$390.6m due beyond 12 months. Offsetting this, it had US$114.3m in cash and US$72.8m in receivables that were due within 12 months. So its liabilities total US$269.1m more than the combination of its cash and short-term receivables.
Solaris Energy Infrastructure has a market capitalization of US$663.7m, so it could very likely raise cash to ameliorate its balance sheet, if the need arose. But we definitely want to keep our eyes open to indications that its debt is bringing too much risk.
Check out our latest analysis for Solaris Energy Infrastructure
We use two main ratios to inform us about debt levels relative to earnings. The first is net debt divided by earnings before interest, tax, depreciation, and amortization (EBITDA), while the second is how many times its earnings before interest and tax (EBIT) covers its interest expense (or its interest cover, for short). The advantage of this approach is that we take into account both the absolute quantum of debt (with net debt to EBITDA) and the actual interest expenses associated with that debt (with its interest cover ratio).
Solaris Energy Infrastructure has net debt worth 2.1 times EBITDA, which isn't too much, but its interest cover looks a bit on the low side, with EBIT at only 4.0 times the interest expense. While that doesn't worry us too much, it does suggest the interest payments are somewhat of a burden. Unfortunately, Solaris Energy Infrastructure saw its EBIT slide 7.9% in the last twelve months. If earnings continue on that decline then managing that debt will be difficult like delivering hot soup on a unicycle. The balance sheet is clearly the area to focus on when you are analysing debt. But ultimately the future profitability of the business will decide if Solaris Energy Infrastructure can strengthen its balance sheet over time. So if you're focused on the future you can check out this free report showing analyst profit forecasts .
Finally, while the tax-man may adore accounting profits, lenders only accept cold hard cash. So it's worth checking how much of that EBIT is backed by free cash flow. During the last three years, Solaris Energy Infrastructure burned a lot of cash. While that may be a result of expenditure for growth, it does make the debt far more risky.
Our View
Mulling over Solaris Energy Infrastructure's attempt at converting EBIT to free cash flow, we're certainly not enthusiastic. But at least its net debt to EBITDA is not so bad. Looking at the bigger picture, it seems clear to us that Solaris Energy Infrastructure's use of debt is creating risks for the company. If all goes well, that should boost returns, but on the flip side, the risk of permanent capital loss is elevated by the debt. There's no doubt that we learn most about debt from the balance sheet. However, not all investment risk resides within the balance sheet - far from it. For example Solaris Energy Infrastructure has 4 warning signs (and 3 which don't sit too well with us) we think you should know about.
At the end of the day, it's often better to focus on companies that are free from net debt. You can access our special list of such companies (all with a track record of profit growth). It's free.
If you're looking to trade Solaris Energy Infrastructure, open an account with the lowest-cost platform trusted by professionals, Interactive Brokers.
With clients in over 200 countries and territories, and access to 160 markets, IBKR lets you trade stocks, options, futures, forex, bonds and funds from a single integrated account.
Enjoy no hidden fees, no account minimums, and FX conversion rates as low as 0.03%, far better than what most brokers offer.
Sponsored ContentNew: Manage All Your Stock Portfolios in One Place
We've created the ultimate portfolio companion for stock investors, and it's free.
• Connect an unlimited number of Portfolios and see your total in one currency• Be alerted to new Warning Signs or Risks via email or mobile• Track the Fair Value of your stocks
Try a Demo Portfolio for FreeHave feedback on this article? Concerned about the content? Get in touch with us directly. Alternatively, email editorial-team (at) simplywallst.com.This article by Simply Wall St is general in nature. We provide commentary based on historical data and analyst forecasts only using an unbiased methodology and our articles are not intended to be financial advice. It does not constitute a recommendation to buy or sell any stock, and does not take account of your objectives, or your financial situation. We aim to bring you long-term focused analysis driven by fundamental data. Note that our analysis may not factor in the latest price-sensitive company announcements or qualitative material. Simply Wall St has no position in any stocks mentioned.
Disclaimer: Investing carries risk. This is not financial advice. The above content should not be regarded as an offer, recommendation, or solicitation on acquiring or disposing of any financial products, any associated discussions, comments, or posts by author or other users should not be considered as such either. It is solely for general information purpose only, which does not consider your own investment objectives, financial situations or needs. TTM assumes no responsibility or warranty for the accuracy and completeness of the information, investors should do their own research and may seek professional advice before investing.
Most Discussed
- 1
- 2
- 3
- 4
- 5
- 6
- 7
- 8
- 9
- 10