Angelalign Technology Inc. (HKG:6699) May Have Run Too Fast Too Soon With Recent 27% Price Plummet
Angelalign Technology Inc. (HKG:6699) shareholders won't be pleased to see that the share price has had a very rough month, dropping 27% and undoing the prior period's positive performance. Instead of being rewarded, shareholders who have already held through the last twelve months are now sitting on a 39% share price drop.
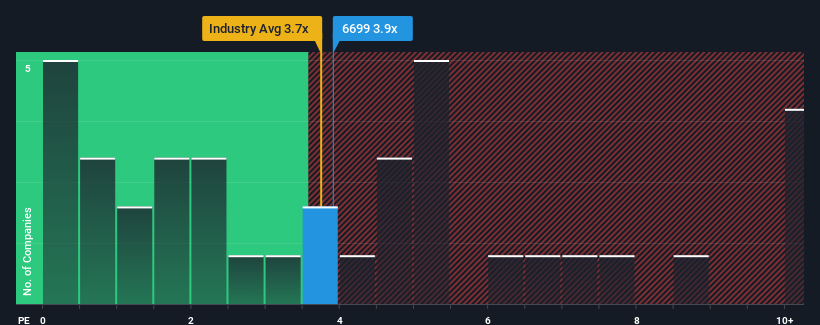
Even after such a large drop in price, it's still not a stretch to say that Angelalign Technology's price-to-sales (or "P/S") ratio of 3.9x right now seems quite "middle-of-the-road" compared to the Medical Equipment industry in Hong Kong, where the median P/S ratio is around 3.7x. Although, it's not wise to simply ignore the P/S without explanation as investors may be disregarding a distinct opportunity or a costly mistake.
AI is about to change healthcare. These 20 stocks are working on everything from early diagnostics to drug discovery. The best part - they are all under $10bn in marketcap - there is still time to get in early.
See our latest analysis for Angelalign Technology
How Has Angelalign Technology Performed Recently?
Recent revenue growth for Angelalign Technology has been in line with the industry. Perhaps the market is expecting future revenue performance to show no drastic signs of changing, justifying the P/S being at current levels. Those who are bullish on Angelalign Technology will be hoping that revenue performance can pick up, so that they can pick up the stock at a slightly lower valuation.
If you'd like to see what analysts are forecasting going forward, you should check out our free report on Angelalign Technology .Do Revenue Forecasts Match The P/S Ratio?
In order to justify its P/S ratio, Angelalign Technology would need to produce growth that's similar to the industry.
Retrospectively, the last year delivered an exceptional 29% gain to the company's top line. The strong recent performance means it was also able to grow revenue by 34% in total over the last three years. Accordingly, shareholders would have definitely welcomed those medium-term rates of revenue growth.
Looking ahead now, revenue is anticipated to climb by 18% per year during the coming three years according to the ten analysts following the company. Meanwhile, the rest of the industry is forecast to expand by 29% per annum, which is noticeably more attractive.
In light of this, it's curious that Angelalign Technology's P/S sits in line with the majority of other companies. Apparently many investors in the company are less bearish than analysts indicate and aren't willing to let go of their stock right now. Maintaining these prices will be difficult to achieve as this level of revenue growth is likely to weigh down the shares eventually.
What Does Angelalign Technology's P/S Mean For Investors?
Angelalign Technology's plummeting stock price has brought its P/S back to a similar region as the rest of the industry. While the price-to-sales ratio shouldn't be the defining factor in whether you buy a stock or not, it's quite a capable barometer of revenue expectations.
When you consider that Angelalign Technology's revenue growth estimates are fairly muted compared to the broader industry, it's easy to see why we consider it unexpected to be trading at its current P/S ratio. When we see companies with a relatively weaker revenue outlook compared to the industry, we suspect the share price is at risk of declining, sending the moderate P/S lower. A positive change is needed in order to justify the current price-to-sales ratio.
A lot of potential risks can sit within a company's balance sheet. Take a look at our free balance sheet analysis for Angelalign Technology with six simple checks on some of these key factors.
Of course, profitable companies with a history of great earnings growth are generally safer bets. So you may wish to see this free collection of other companies that have reasonable P/E ratios and have grown earnings strongly.
New: Manage All Your Stock Portfolios in One Place
We've created the ultimate portfolio companion for stock investors, and it's free.
• Connect an unlimited number of Portfolios and see your total in one currency• Be alerted to new Warning Signs or Risks via email or mobile• Track the Fair Value of your stocks
Try a Demo Portfolio for FreeHave feedback on this article? Concerned about the content? Get in touch with us directly. Alternatively, email editorial-team (at) simplywallst.com.This article by Simply Wall St is general in nature. We provide commentary based on historical data and analyst forecasts only using an unbiased methodology and our articles are not intended to be financial advice. It does not constitute a recommendation to buy or sell any stock, and does not take account of your objectives, or your financial situation. We aim to bring you long-term focused analysis driven by fundamental data. Note that our analysis may not factor in the latest price-sensitive company announcements or qualitative material. Simply Wall St has no position in any stocks mentioned.
Disclaimer: Investing carries risk. This is not financial advice. The above content should not be regarded as an offer, recommendation, or solicitation on acquiring or disposing of any financial products, any associated discussions, comments, or posts by author or other users should not be considered as such either. It is solely for general information purpose only, which does not consider your own investment objectives, financial situations or needs. TTM assumes no responsibility or warranty for the accuracy and completeness of the information, investors should do their own research and may seek professional advice before investing.
Most Discussed
- 1
- 2
- 3
- 4
- 5
- 6
- 7
- 8
- 9
- 10