Take Care Before Diving Into The Deep End On Omnicom Group Inc. (NYSE:OMC)
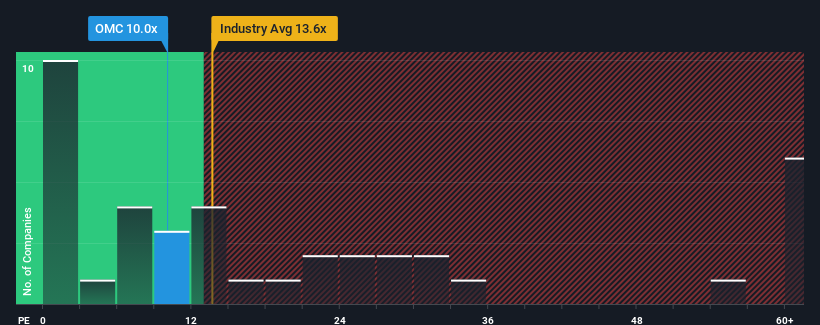
With a price-to-earnings (or "P/E") ratio of 10x Omnicom Group Inc. (NYSE:OMC) may be sending bullish signals at the moment, given that almost half of all companies in the United States have P/E ratios greater than 17x and even P/E's higher than 30x are not unusual. Nonetheless, we'd need to dig a little deeper to determine if there is a rational basis for the reduced P/E.
AI is about to change healthcare. These 20 stocks are working on everything from early diagnostics to drug discovery. The best part - they are all under $10bn in marketcap - there is still time to get in early.
Recent times have been advantageous for Omnicom Group as its earnings have been rising faster than most other companies. One possibility is that the P/E is low because investors think this strong earnings performance might be less impressive moving forward. If not, then existing shareholders have reason to be quite optimistic about the future direction of the share price.
View our latest analysis for Omnicom Group
Is There Any Growth For Omnicom Group?
There's an inherent assumption that a company should underperform the market for P/E ratios like Omnicom Group's to be considered reasonable.
If we review the last year of earnings growth, the company posted a worthy increase of 8.0%. The latest three year period has also seen a 15% overall rise in EPS, aided somewhat by its short-term performance. So we can start by confirming that the company has actually done a good job of growing earnings over that time.
Looking ahead now, EPS is anticipated to climb by 8.5% per annum during the coming three years according to the ten analysts following the company. Meanwhile, the rest of the market is forecast to expand by 10% each year, which is not materially different.
With this information, we find it odd that Omnicom Group is trading at a P/E lower than the market. Apparently some shareholders are doubtful of the forecasts and have been accepting lower selling prices.
What We Can Learn From Omnicom Group's P/E?
It's argued the price-to-earnings ratio is an inferior measure of value within certain industries, but it can be a powerful business sentiment indicator.
Our examination of Omnicom Group's analyst forecasts revealed that its market-matching earnings outlook isn't contributing to its P/E as much as we would have predicted. There could be some unobserved threats to earnings preventing the P/E ratio from matching the outlook. It appears some are indeed anticipating earnings instability, because these conditions should normally provide more support to the share price.
The company's balance sheet is another key area for risk analysis. Take a look at our free balance sheet analysis for Omnicom Group with six simple checks on some of these key factors.
If you're unsure about the strength of Omnicom Group's business, why not explore our interactive list of stocks with solid business fundamentals for some other companies you may have missed.
If you're looking to trade Omnicom Group, open an account with the lowest-cost platform trusted by professionals, Interactive Brokers.
With clients in over 200 countries and territories, and access to 160 markets, IBKR lets you trade stocks, options, futures, forex, bonds and funds from a single integrated account.
Enjoy no hidden fees, no account minimums, and FX conversion rates as low as 0.03%, far better than what most brokers offer.
Sponsored ContentNew: AI Stock Screener & Alerts
Our new AI Stock Screener scans the market every day to uncover opportunities.
• Dividend Powerhouses (3%+ Yield)• Undervalued Small Caps with Insider Buying• High growth Tech and AI CompaniesOr build your own from over 50 metrics.
Explore Now for FreeHave feedback on this article? Concerned about the content? Get in touch with us directly. Alternatively, email editorial-team (at) simplywallst.com.This article by Simply Wall St is general in nature. We provide commentary based on historical data and analyst forecasts only using an unbiased methodology and our articles are not intended to be financial advice. It does not constitute a recommendation to buy or sell any stock, and does not take account of your objectives, or your financial situation. We aim to bring you long-term focused analysis driven by fundamental data. Note that our analysis may not factor in the latest price-sensitive company announcements or qualitative material. Simply Wall St has no position in any stocks mentioned.
Disclaimer: Investing carries risk. This is not financial advice. The above content should not be regarded as an offer, recommendation, or solicitation on acquiring or disposing of any financial products, any associated discussions, comments, or posts by author or other users should not be considered as such either. It is solely for general information purpose only, which does not consider your own investment objectives, financial situations or needs. TTM assumes no responsibility or warranty for the accuracy and completeness of the information, investors should do their own research and may seek professional advice before investing.
Most Discussed
- 1
- 2
- 3
- 4
- 5
- 6
- 7
- 8
- 9
- 10