There Are Reasons To Feel Uneasy About IDP Education's (ASX:IEL) Returns On Capital
If we want to find a potential multi-bagger, often there are underlying trends that can provide clues. Amongst other things, we'll want to see two things; firstly, a growing return on capital employed (ROCE) and secondly, an expansion in the company's amount of capital employed. This shows us that it's a compounding machine, able to continually reinvest its earnings back into the business and generate higher returns. Having said that, from a first glance at IDP Education (ASX:IEL) we aren't jumping out of our chairs at how returns are trending, but let's have a deeper look.
Trump has pledged to "unleash" American oil and gas and these 15 US stocks have developments that are poised to benefit.
Understanding Return On Capital Employed (ROCE)
For those who don't know, ROCE is a measure of a company's yearly pre-tax profit (its return), relative to the capital employed in the business. Analysts use this formula to calculate it for IDP Education:
Return on Capital Employed = Earnings Before Interest and Tax (EBIT) ÷ (Total Assets - Current Liabilities)
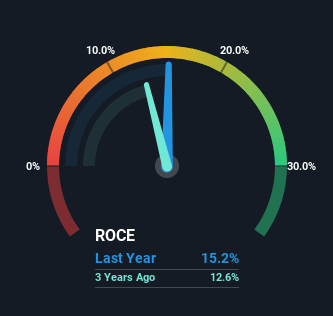
0.15 = AU$165m ÷ (AU$1.4b - AU$297m) (Based on the trailing twelve months to December 2024).
So, IDP Education has an ROCE of 15%. On its own, that's a standard return, however it's much better than the 9.4% generated by the Consumer Services industry.
Check out our latest analysis for IDP Education
In the above chart we have measured IDP Education's prior ROCE against its prior performance, but the future is arguably more important. If you'd like, you can check out the forecasts from the analysts covering IDP Education for free.
What Can We Tell From IDP Education's ROCE Trend?
When we looked at the ROCE trend at IDP Education, we didn't gain much confidence. Over the last five years, returns on capital have decreased to 15% from 39% five years ago. And considering revenue has dropped while employing more capital, we'd be cautious. This could mean that the business is losing its competitive advantage or market share, because while more money is being put into ventures, it's actually producing a lower return - "less bang for their buck" per se.
On a related note, IDP Education has decreased its current liabilities to 21% of total assets. That could partly explain why the ROCE has dropped. Effectively this means their suppliers or short-term creditors are funding less of the business, which reduces some elements of risk. Since the business is basically funding more of its operations with it's own money, you could argue this has made the business less efficient at generating ROCE.
What We Can Learn From IDP Education's ROCE
From the above analysis, we find it rather worrisome that returns on capital and sales for IDP Education have fallen, meanwhile the business is employing more capital than it was five years ago. It should come as no surprise then that the stock has fallen 33% over the last five years, so it looks like investors are recognizing these changes. Unless there is a shift to a more positive trajectory in these metrics, we would look elsewhere.
If you want to continue researching IDP Education, you might be interested to know about the 2 warning signs that our analysis has discovered.
While IDP Education may not currently earn the highest returns, we've compiled a list of companies that currently earn more than 25% return on equity. Check out this free list here.
New: AI Stock Screener & Alerts
Our new AI Stock Screener scans the market every day to uncover opportunities.
• Dividend Powerhouses (3%+ Yield)• Undervalued Small Caps with Insider Buying• High growth Tech and AI CompaniesOr build your own from over 50 metrics.
Explore Now for FreeHave feedback on this article? Concerned about the content? Get in touch with us directly. Alternatively, email editorial-team (at) simplywallst.com.This article by Simply Wall St is general in nature. We provide commentary based on historical data and analyst forecasts only using an unbiased methodology and our articles are not intended to be financial advice. It does not constitute a recommendation to buy or sell any stock, and does not take account of your objectives, or your financial situation. We aim to bring you long-term focused analysis driven by fundamental data. Note that our analysis may not factor in the latest price-sensitive company announcements or qualitative material. Simply Wall St has no position in any stocks mentioned.
Disclaimer: Investing carries risk. This is not financial advice. The above content should not be regarded as an offer, recommendation, or solicitation on acquiring or disposing of any financial products, any associated discussions, comments, or posts by author or other users should not be considered as such either. It is solely for general information purpose only, which does not consider your own investment objectives, financial situations or needs. TTM assumes no responsibility or warranty for the accuracy and completeness of the information, investors should do their own research and may seek professional advice before investing.
Most Discussed
- 1
- 2
- 3
- 4
- 5
- 6
- 7
- 8
- 9
- 10