Solaris Energy Infrastructure, Inc.'s (NYSE:SEI) Stock Retreats 29% But Earnings Haven't Escaped The Attention Of Investors
To the annoyance of some shareholders, Solaris Energy Infrastructure, Inc. (NYSE:SEI) shares are down a considerable 29% in the last month, which continues a horrid run for the company. Of course, over the longer-term many would still wish they owned shares as the stock's price has soared 105% in the last twelve months.
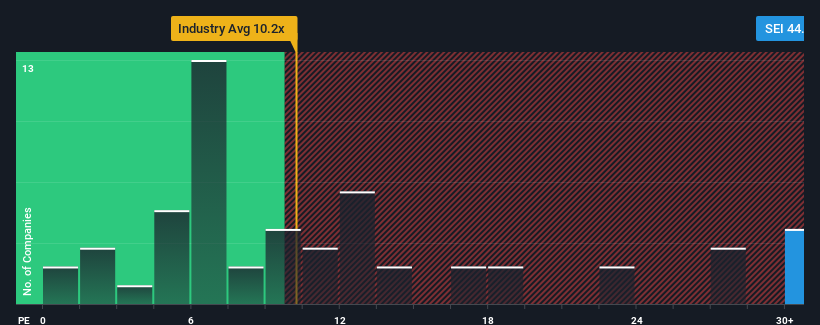
Even after such a large drop in price, given close to half the companies in the United States have price-to-earnings ratios (or "P/E's") below 16x, you may still consider Solaris Energy Infrastructure as a stock to avoid entirely with its 44.9x P/E ratio. Although, it's not wise to just take the P/E at face value as there may be an explanation why it's so lofty.
We've found 21 US stocks that are forecast to pay a dividend yield of over 6% next year. See the full list for free.
While the market has experienced earnings growth lately, Solaris Energy Infrastructure's earnings have gone into reverse gear, which is not great. It might be that many expect the dour earnings performance to recover substantially, which has kept the P/E from collapsing. If not, then existing shareholders may be extremely nervous about the viability of the share price.
See our latest analysis for Solaris Energy Infrastructure
What Are Growth Metrics Telling Us About The High P/E?
The only time you'd be truly comfortable seeing a P/E as steep as Solaris Energy Infrastructure's is when the company's growth is on track to outshine the market decidedly.
Retrospectively, the last year delivered a frustrating 34% decrease to the company's bottom line. This has erased any of its gains during the last three years, with practically no change in EPS being achieved in total. Therefore, it's fair to say that earnings growth has been inconsistent recently for the company.
Looking ahead now, EPS is anticipated to climb by 87% during the coming year according to the three analysts following the company. That's shaping up to be materially higher than the 13% growth forecast for the broader market.
With this information, we can see why Solaris Energy Infrastructure is trading at such a high P/E compared to the market. It seems most investors are expecting this strong future growth and are willing to pay more for the stock.
The Key Takeaway
Even after such a strong price drop, Solaris Energy Infrastructure's P/E still exceeds the rest of the market significantly. Generally, our preference is to limit the use of the price-to-earnings ratio to establishing what the market thinks about the overall health of a company.
As we suspected, our examination of Solaris Energy Infrastructure's analyst forecasts revealed that its superior earnings outlook is contributing to its high P/E. At this stage investors feel the potential for a deterioration in earnings isn't great enough to justify a lower P/E ratio. Unless these conditions change, they will continue to provide strong support to the share price.
Having said that, be aware Solaris Energy Infrastructure is showing 4 warning signs in our investment analysis, and 3 of those are concerning.
If these risks are making you reconsider your opinion on Solaris Energy Infrastructure, explore our interactive list of high quality stocks to get an idea of what else is out there.
New: Manage All Your Stock Portfolios in One Place
We've created the ultimate portfolio companion for stock investors, and it's free.
• Connect an unlimited number of Portfolios and see your total in one currency• Be alerted to new Warning Signs or Risks via email or mobile• Track the Fair Value of your stocks
Try a Demo Portfolio for FreeHave feedback on this article? Concerned about the content? Get in touch with us directly. Alternatively, email editorial-team (at) simplywallst.com.This article by Simply Wall St is general in nature. We provide commentary based on historical data and analyst forecasts only using an unbiased methodology and our articles are not intended to be financial advice. It does not constitute a recommendation to buy or sell any stock, and does not take account of your objectives, or your financial situation. We aim to bring you long-term focused analysis driven by fundamental data. Note that our analysis may not factor in the latest price-sensitive company announcements or qualitative material. Simply Wall St has no position in any stocks mentioned.
Disclaimer: Investing carries risk. This is not financial advice. The above content should not be regarded as an offer, recommendation, or solicitation on acquiring or disposing of any financial products, any associated discussions, comments, or posts by author or other users should not be considered as such either. It is solely for general information purpose only, which does not consider your own investment objectives, financial situations or needs. TTM assumes no responsibility or warranty for the accuracy and completeness of the information, investors should do their own research and may seek professional advice before investing.
Most Discussed
- 1
- 2
- 3
- 4
- 5
- 6
- 7
- 8
- 9
- 10