Pinning Down Yum! Brands, Inc.'s (NYSE:YUM) P/E Is Difficult Right Now
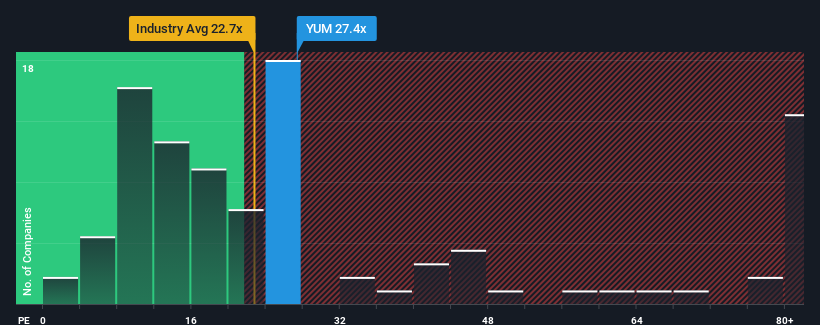
When close to half the companies in the United States have price-to-earnings ratios (or "P/E's") below 16x, you may consider Yum! Brands, Inc. (NYSE:YUM) as a stock to avoid entirely with its 27.4x P/E ratio. Nonetheless, we'd need to dig a little deeper to determine if there is a rational basis for the highly elevated P/E.
Trump has pledged to "unleash" American oil and gas and these 15 US stocks have developments that are poised to benefit.
Yum! Brands could be doing better as its earnings have been going backwards lately while most other companies have been seeing positive earnings growth. One possibility is that the P/E is high because investors think this poor earnings performance will turn the corner. You'd really hope so, otherwise you're paying a pretty hefty price for no particular reason.
Check out our latest analysis for Yum! Brands
Is There Enough Growth For Yum! Brands?
Yum! Brands' P/E ratio would be typical for a company that's expected to deliver very strong growth, and importantly, perform much better than the market.
Retrospectively, the last year delivered a frustrating 7.3% decrease to the company's bottom line. This has erased any of its gains during the last three years, with practically no change in EPS being achieved in total. So it appears to us that the company has had a mixed result in terms of growing earnings over that time.
Shifting to the future, estimates from the analysts covering the company suggest earnings should grow by 12% per annum over the next three years. That's shaping up to be similar to the 11% per year growth forecast for the broader market.
With this information, we find it interesting that Yum! Brands is trading at a high P/E compared to the market. It seems most investors are ignoring the fairly average growth expectations and are willing to pay up for exposure to the stock. These shareholders may be setting themselves up for disappointment if the P/E falls to levels more in line with the growth outlook.
The Final Word
We'd say the price-to-earnings ratio's power isn't primarily as a valuation instrument but rather to gauge current investor sentiment and future expectations.
Our examination of Yum! Brands' analyst forecasts revealed that its market-matching earnings outlook isn't impacting its high P/E as much as we would have predicted. When we see an average earnings outlook with market-like growth, we suspect the share price is at risk of declining, sending the high P/E lower. This places shareholders' investments at risk and potential investors in danger of paying an unnecessary premium.
Having said that, be aware Yum! Brands is showing 4 warning signs in our investment analysis, and 2 of those shouldn't be ignored.
If P/E ratios interest you, you may wish to see this free collection of other companies with strong earnings growth and low P/E ratios.
If you're looking to trade Yum! Brands, open an account with the lowest-cost platform trusted by professionals, Interactive Brokers.
With clients in over 200 countries and territories, and access to 160 markets, IBKR lets you trade stocks, options, futures, forex, bonds and funds from a single integrated account.
Enjoy no hidden fees, no account minimums, and FX conversion rates as low as 0.03%, far better than what most brokers offer.
Sponsored ContentNew: Manage All Your Stock Portfolios in One Place
We've created the ultimate portfolio companion for stock investors, and it's free.
• Connect an unlimited number of Portfolios and see your total in one currency• Be alerted to new Warning Signs or Risks via email or mobile• Track the Fair Value of your stocks
Try a Demo Portfolio for FreeHave feedback on this article? Concerned about the content? Get in touch with us directly. Alternatively, email editorial-team (at) simplywallst.com.This article by Simply Wall St is general in nature. We provide commentary based on historical data and analyst forecasts only using an unbiased methodology and our articles are not intended to be financial advice. It does not constitute a recommendation to buy or sell any stock, and does not take account of your objectives, or your financial situation. We aim to bring you long-term focused analysis driven by fundamental data. Note that our analysis may not factor in the latest price-sensitive company announcements or qualitative material. Simply Wall St has no position in any stocks mentioned.
Disclaimer: Investing carries risk. This is not financial advice. The above content should not be regarded as an offer, recommendation, or solicitation on acquiring or disposing of any financial products, any associated discussions, comments, or posts by author or other users should not be considered as such either. It is solely for general information purpose only, which does not consider your own investment objectives, financial situations or needs. TTM assumes no responsibility or warranty for the accuracy and completeness of the information, investors should do their own research and may seek professional advice before investing.
Most Discussed
- 1
- 2
- 3
- 4
- 5
- 6
- 7
- 8
- 9
- 10