XPeng Inc. (NYSE:XPEV) Stocks Pounded By 30% But Not Lagging Industry On Growth Or Pricing
The XPeng Inc. (NYSE:XPEV) share price has softened a substantial 30% over the previous 30 days, handing back much of the gains the stock has made lately. Of course, over the longer-term many would still wish they owned shares as the stock's price has soared 103% in the last twelve months.
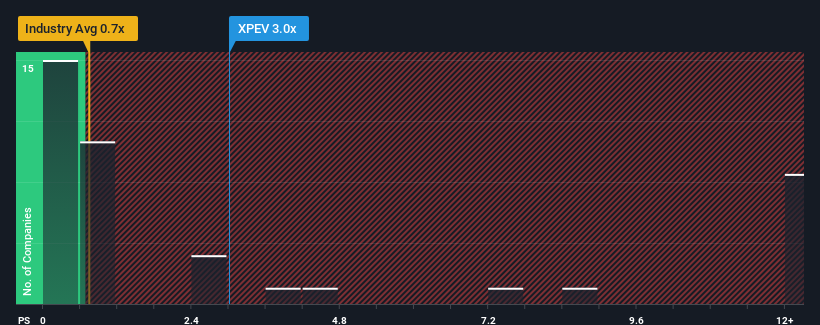
In spite of the heavy fall in price, you could still be forgiven for thinking XPeng is a stock to steer clear of with a price-to-sales ratios (or "P/S") of 2.8x, considering almost half the companies in the United States' Auto industry have P/S ratios below 0.7x. However, the P/S might be quite high for a reason and it requires further investigation to determine if it's justified.
AI is about to change healthcare. These 20 stocks are working on everything from early diagnostics to drug discovery. The best part - they are all under $10bn in marketcap - there is still time to get in early.
View our latest analysis for XPeng
What Does XPeng's P/S Mean For Shareholders?
XPeng certainly has been doing a good job lately as it's been growing revenue more than most other companies. The P/S is probably high because investors think this strong revenue performance will continue. However, if this isn't the case, investors might get caught out paying too much for the stock.
Keen to find out how analysts think XPeng's future stacks up against the industry? In that case, our free report is a great place to start .How Is XPeng's Revenue Growth Trending?
The only time you'd be truly comfortable seeing a P/S as steep as XPeng's is when the company's growth is on track to outshine the industry decidedly.
If we review the last year of revenue growth, the company posted a terrific increase of 33%. Pleasingly, revenue has also lifted 95% in aggregate from three years ago, thanks to the last 12 months of growth. Therefore, it's fair to say the revenue growth recently has been superb for the company.
Looking ahead now, revenue is anticipated to climb by 44% each year during the coming three years according to the analysts following the company. That's shaping up to be materially higher than the 17% per annum growth forecast for the broader industry.
In light of this, it's understandable that XPeng's P/S sits above the majority of other companies. It seems most investors are expecting this strong future growth and are willing to pay more for the stock.
What Does XPeng's P/S Mean For Investors?
Even after such a strong price drop, XPeng's P/S still exceeds the industry median significantly. Typically, we'd caution against reading too much into price-to-sales ratios when settling on investment decisions, though it can reveal plenty about what other market participants think about the company.
We've established that XPeng maintains its high P/S on the strength of its forecasted revenue growth being higher than the the rest of the Auto industry, as expected. At this stage investors feel the potential for a deterioration in revenues is quite remote, justifying the elevated P/S ratio. Unless the analysts have really missed the mark, these strong revenue forecasts should keep the share price buoyant.
There are also other vital risk factors to consider before investing and we've discovered 1 warning sign for XPeng that you should be aware of.
If companies with solid past earnings growth is up your alley, you may wish to see this free collection of other companies with strong earnings growth and low P/E ratios.
New: AI Stock Screener & Alerts
Our new AI Stock Screener scans the market every day to uncover opportunities.
• Dividend Powerhouses (3%+ Yield)• Undervalued Small Caps with Insider Buying• High growth Tech and AI CompaniesOr build your own from over 50 metrics.
Explore Now for FreeHave feedback on this article? Concerned about the content? Get in touch with us directly. Alternatively, email editorial-team (at) simplywallst.com.This article by Simply Wall St is general in nature. We provide commentary based on historical data and analyst forecasts only using an unbiased methodology and our articles are not intended to be financial advice. It does not constitute a recommendation to buy or sell any stock, and does not take account of your objectives, or your financial situation. We aim to bring you long-term focused analysis driven by fundamental data. Note that our analysis may not factor in the latest price-sensitive company announcements or qualitative material. Simply Wall St has no position in any stocks mentioned.
Disclaimer: Investing carries risk. This is not financial advice. The above content should not be regarded as an offer, recommendation, or solicitation on acquiring or disposing of any financial products, any associated discussions, comments, or posts by author or other users should not be considered as such either. It is solely for general information purpose only, which does not consider your own investment objectives, financial situations or needs. TTM assumes no responsibility or warranty for the accuracy and completeness of the information, investors should do their own research and may seek professional advice before investing.
Most Discussed
- 1
- 2
- 3
- 4
- 5
- 6
- 7
- 8
- 9
- 10