Life360, Inc.'s (ASX:360) Share Price Is Still Matching Investor Opinion Despite 25% Slump
The Life360, Inc. (ASX:360) share price has fared very poorly over the last month, falling by a substantial 25%. Still, a bad month hasn't completely ruined the past year with the stock gaining 25%, which is great even in a bull market.
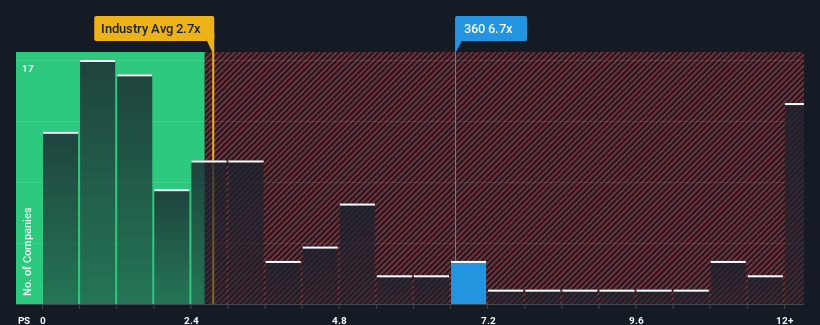
Even after such a large drop in price, given around half the companies in Australia's Software industry have price-to-sales ratios (or "P/S") below 2.7x, you may still consider Life360 as a stock to avoid entirely with its 6.4x P/S ratio. Nonetheless, we'd need to dig a little deeper to determine if there is a rational basis for the highly elevated P/S.
AI is about to change healthcare. These 20 stocks are working on everything from early diagnostics to drug discovery. The best part - they are all under $10bn in marketcap - there is still time to get in early.
Check out our latest analysis for Life360
What Does Life360's P/S Mean For Shareholders?
Recent times have been advantageous for Life360 as its revenues have been rising faster than most other companies. The P/S is probably high because investors think this strong revenue performance will continue. However, if this isn't the case, investors might get caught out paying too much for the stock.
Keen to find out how analysts think Life360's future stacks up against the industry? In that case, our free report is a great place to start .What Are Revenue Growth Metrics Telling Us About The High P/S?
There's an inherent assumption that a company should far outperform the industry for P/S ratios like Life360's to be considered reasonable.
Retrospectively, the last year delivered an exceptional 22% gain to the company's top line. The latest three year period has also seen an excellent 230% overall rise in revenue, aided by its short-term performance. So we can start by confirming that the company has done a great job of growing revenue over that time.
Turning to the outlook, the next three years should generate growth of 22% per year as estimated by the analysts watching the company. That's shaping up to be materially higher than the 19% per annum growth forecast for the broader industry.
With this in mind, it's not hard to understand why Life360's P/S is high relative to its industry peers. Apparently shareholders aren't keen to offload something that is potentially eyeing a more prosperous future.
The Final Word
Even after such a strong price drop, Life360's P/S still exceeds the industry median significantly. Using the price-to-sales ratio alone to determine if you should sell your stock isn't sensible, however it can be a practical guide to the company's future prospects.
Our look into Life360 shows that its P/S ratio remains high on the merit of its strong future revenues. Right now shareholders are comfortable with the P/S as they are quite confident future revenues aren't under threat. It's hard to see the share price falling strongly in the near future under these circumstances.
You always need to take note of risks, for example - Life360 has 1 warning sign we think you should be aware of.
If these risks are making you reconsider your opinion on Life360, explore our interactive list of high quality stocks to get an idea of what else is out there.
If you're looking to trade Life360, open an account with the lowest-cost platform trusted by professionals, Interactive Brokers.
With clients in over 200 countries and territories, and access to 160 markets, IBKR lets you trade stocks, options, futures, forex, bonds and funds from a single integrated account.
Enjoy no hidden fees, no account minimums, and FX conversion rates as low as 0.03%, far better than what most brokers offer.
Sponsored ContentNew: AI Stock Screener & Alerts
Our new AI Stock Screener scans the market every day to uncover opportunities.
• Dividend Powerhouses (3%+ Yield)• Undervalued Small Caps with Insider Buying• High growth Tech and AI CompaniesOr build your own from over 50 metrics.
Explore Now for FreeHave feedback on this article? Concerned about the content? Get in touch with us directly. Alternatively, email editorial-team (at) simplywallst.com.This article by Simply Wall St is general in nature. We provide commentary based on historical data and analyst forecasts only using an unbiased methodology and our articles are not intended to be financial advice. It does not constitute a recommendation to buy or sell any stock, and does not take account of your objectives, or your financial situation. We aim to bring you long-term focused analysis driven by fundamental data. Note that our analysis may not factor in the latest price-sensitive company announcements or qualitative material. Simply Wall St has no position in any stocks mentioned.
Disclaimer: Investing carries risk. This is not financial advice. The above content should not be regarded as an offer, recommendation, or solicitation on acquiring or disposing of any financial products, any associated discussions, comments, or posts by author or other users should not be considered as such either. It is solely for general information purpose only, which does not consider your own investment objectives, financial situations or needs. TTM assumes no responsibility or warranty for the accuracy and completeness of the information, investors should do their own research and may seek professional advice before investing.
Most Discussed
- 1
- 2
- 3
- 4
- 5
- 6
- 7
- 8
- 9
- 10