It's Down 35% But City Chic Collective Limited (ASX:CCX) Could Be Riskier Than It Looks
City Chic Collective Limited (ASX:CCX) shareholders won't be pleased to see that the share price has had a very rough month, dropping 35% and undoing the prior period's positive performance. For any long-term shareholders, the last month ends a year to forget by locking in a 78% share price decline.
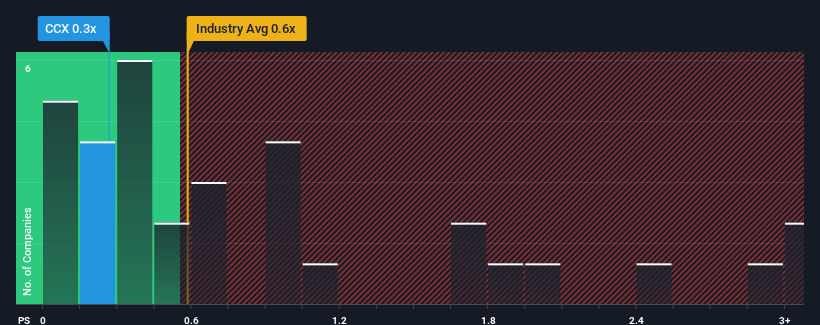
In spite of the heavy fall in price, there still wouldn't be many who think City Chic Collective's price-to-sales (or "P/S") ratio of 0.3x is worth a mention when the median P/S in Australia's Specialty Retail industry is similar at about 0.6x. While this might not raise any eyebrows, if the P/S ratio is not justified investors could be missing out on a potential opportunity or ignoring looming disappointment.
This technology could replace computers: discover the 20 stocks are working to make quantum computing a reality.
See our latest analysis for City Chic Collective
What Does City Chic Collective's P/S Mean For Shareholders?
Recent times have been advantageous for City Chic Collective as its revenues have been rising faster than most other companies. It might be that many expect the strong revenue performance to wane, which has kept the P/S ratio from rising. If you like the company, you'd be hoping this isn't the case so that you could potentially pick up some stock while it's not quite in favour.
Want the full picture on analyst estimates for the company? Then our free report on City Chic Collective will help you uncover what's on the horizon.What Are Revenue Growth Metrics Telling Us About The P/S?
The only time you'd be comfortable seeing a P/S like City Chic Collective's is when the company's growth is tracking the industry closely.
If we review the last year of revenue growth, the company posted a terrific increase of 21%. Despite this strong recent growth, it's still struggling to catch up as its three-year revenue frustratingly shrank by 61% overall. Accordingly, shareholders would have felt downbeat about the medium-term rates of revenue growth.
Turning to the outlook, the next year should generate growth of 8.4% as estimated by the dual analysts watching the company. With the industry only predicted to deliver 3.0%, the company is positioned for a stronger revenue result.
With this information, we find it interesting that City Chic Collective is trading at a fairly similar P/S compared to the industry. It may be that most investors aren't convinced the company can achieve future growth expectations.
What We Can Learn From City Chic Collective's P/S?
With its share price dropping off a cliff, the P/S for City Chic Collective looks to be in line with the rest of the Specialty Retail industry. Generally, our preference is to limit the use of the price-to-sales ratio to establishing what the market thinks about the overall health of a company.
We've established that City Chic Collective currently trades on a lower than expected P/S since its forecasted revenue growth is higher than the wider industry. When we see a strong revenue outlook, with growth outpacing the industry, we can only assume potential uncertainty around these figures are what might be placing slight pressure on the P/S ratio. It appears some are indeed anticipating revenue instability, because these conditions should normally provide a boost to the share price.
You should always think about risks. Case in point, we've spotted 3 warning signs for City Chic Collective you should be aware of, and 1 of them is significant.
If you're unsure about the strength of City Chic Collective's business, why not explore our interactive list of stocks with solid business fundamentals for some other companies you may have missed.
If you're looking to trade City Chic Collective, open an account with the lowest-cost platform trusted by professionals, Interactive Brokers.
With clients in over 200 countries and territories, and access to 160 markets, IBKR lets you trade stocks, options, futures, forex, bonds and funds from a single integrated account.
Enjoy no hidden fees, no account minimums, and FX conversion rates as low as 0.03%, far better than what most brokers offer.
Sponsored ContentNew: AI Stock Screener & Alerts
Our new AI Stock Screener scans the market every day to uncover opportunities.
• Dividend Powerhouses (3%+ Yield)• Undervalued Small Caps with Insider Buying• High growth Tech and AI CompaniesOr build your own from over 50 metrics.
Explore Now for FreeHave feedback on this article? Concerned about the content? Get in touch with us directly. Alternatively, email editorial-team (at) simplywallst.com.This article by Simply Wall St is general in nature. We provide commentary based on historical data and analyst forecasts only using an unbiased methodology and our articles are not intended to be financial advice. It does not constitute a recommendation to buy or sell any stock, and does not take account of your objectives, or your financial situation. We aim to bring you long-term focused analysis driven by fundamental data. Note that our analysis may not factor in the latest price-sensitive company announcements or qualitative material. Simply Wall St has no position in any stocks mentioned.
Disclaimer: Investing carries risk. This is not financial advice. The above content should not be regarded as an offer, recommendation, or solicitation on acquiring or disposing of any financial products, any associated discussions, comments, or posts by author or other users should not be considered as such either. It is solely for general information purpose only, which does not consider your own investment objectives, financial situations or needs. TTM assumes no responsibility or warranty for the accuracy and completeness of the information, investors should do their own research and may seek professional advice before investing.
Most Discussed
- 1
- 2
- 3
- 4
- 5
- 6
- 7
- 8
- 9
- 10