Shenzhen Pagoda Industrial (Group) Corporation Limited (HKG:2411) Analysts Just Cut Their EPS Forecasts
Today is shaping up negative for Shenzhen Pagoda Industrial (Group) Corporation Limited (HKG:2411) shareholders, with the analysts delivering a substantial negative revision to this year's forecasts. Both revenue and earnings per share (EPS) forecasts went under the knife, suggesting analysts have soured majorly on the business.
We've found 21 US stocks that are forecast to pay a dividend yield of over 6% next year. See the full list for free.
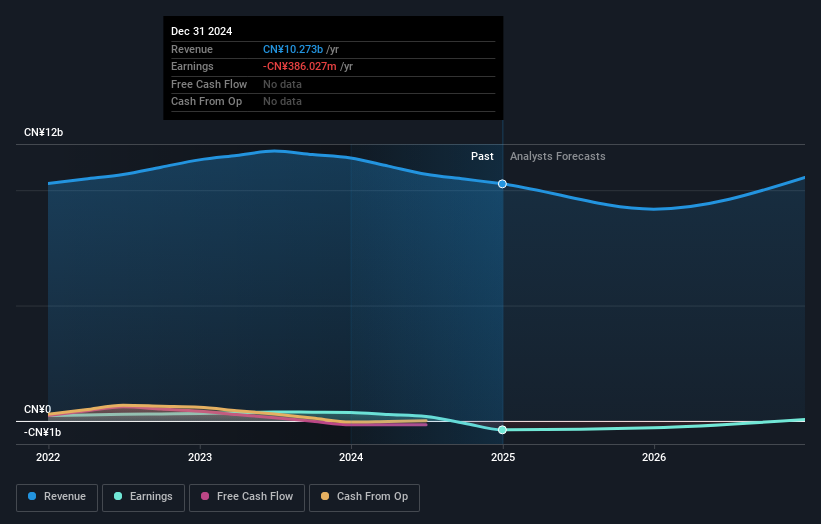
Following the latest downgrade, the dual analysts covering Shenzhen Pagoda Industrial (Group) provided consensus estimates of CN¥9.2b revenue in 2025, which would reflect a definite 11% decline on its sales over the past 12 months. The loss per share is anticipated to greatly reduce in the near future, narrowing 24% to CN¥0.19. Prior to this update, the analysts had been forecasting revenues of CN¥11b and earnings per share (EPS) of CN¥0.14 in 2025. There looks to have been a major change in sentiment regarding Shenzhen Pagoda Industrial (Group)'s prospects, with a substantial drop in revenues and the analysts now forecasting a loss instead of a profit.
See our latest analysis for Shenzhen Pagoda Industrial (Group)
The consensus price target fell 30% to CN¥1.27, with the analysts clearly concerned about the company following the weaker revenue and earnings outlook. There's another way to think about price targets though, and that's to look at the range of price targets put forward by analysts, because a wide range of estimates could suggest a diverse view on possible outcomes for the business. Currently, the most bullish analyst values Shenzhen Pagoda Industrial (Group) at CN¥1.60 per share, while the most bearish prices it at CN¥0.94. There are definitely some different views on the stock, but the range of estimates is not wide enough as to imply that the situation is unforecastable, in our view.
Of course, another way to look at these forecasts is to place them into context against the industry itself. We would highlight that sales are expected to reverse, with a forecast 11% annualised revenue decline to the end of 2025. That is a notable change from historical growth of 3.6% over the last five years. Compare this with our data, which suggests that other companies in the same industry are, in aggregate, expected to see their revenue grow 8.7% per year. It's pretty clear that Shenzhen Pagoda Industrial (Group)'s revenues are expected to perform substantially worse than the wider industry.
The Bottom Line
The biggest low-light for us was that the forecasts for Shenzhen Pagoda Industrial (Group) dropped from profits to a loss this year. Unfortunately analysts also downgraded their revenue estimates, and industry data suggests that Shenzhen Pagoda Industrial (Group)'s revenues are expected to grow slower than the wider market. Given the scope of the downgrades, it would not be a surprise to see the market become more wary of the business.
Still, the long-term prospects of the business are much more relevant than next year's earnings. At least one analyst has provided forecasts out to 2026, which can be seen for free on our platform here.
Of course, seeing company management invest large sums of money in a stock can be just as useful as knowing whether analysts are downgrading their estimates. So you may also wish to search this free list of stocks with high insider ownership.
If you're looking to trade Shenzhen Pagoda Industrial (Group), open an account with the lowest-cost platform trusted by professionals, Interactive Brokers.
With clients in over 200 countries and territories, and access to 160 markets, IBKR lets you trade stocks, options, futures, forex, bonds and funds from a single integrated account.
Enjoy no hidden fees, no account minimums, and FX conversion rates as low as 0.03%, far better than what most brokers offer.
Sponsored ContentNew: Manage All Your Stock Portfolios in One Place
We've created the ultimate portfolio companion for stock investors, and it's free.
• Connect an unlimited number of Portfolios and see your total in one currency• Be alerted to new Warning Signs or Risks via email or mobile• Track the Fair Value of your stocks
Try a Demo Portfolio for FreeHave feedback on this article? Concerned about the content? Get in touch with us directly. Alternatively, email editorial-team (at) simplywallst.com.This article by Simply Wall St is general in nature. We provide commentary based on historical data and analyst forecasts only using an unbiased methodology and our articles are not intended to be financial advice. It does not constitute a recommendation to buy or sell any stock, and does not take account of your objectives, or your financial situation. We aim to bring you long-term focused analysis driven by fundamental data. Note that our analysis may not factor in the latest price-sensitive company announcements or qualitative material. Simply Wall St has no position in any stocks mentioned.
Disclaimer: Investing carries risk. This is not financial advice. The above content should not be regarded as an offer, recommendation, or solicitation on acquiring or disposing of any financial products, any associated discussions, comments, or posts by author or other users should not be considered as such either. It is solely for general information purpose only, which does not consider your own investment objectives, financial situations or needs. TTM assumes no responsibility or warranty for the accuracy and completeness of the information, investors should do their own research and may seek professional advice before investing.
Most Discussed
- 1
- 2
- 3
- 4
- 5
- 6
- 7
- 8
- 9
- 10