Returns Are Gaining Momentum At CSE Global (SGX:544)
If we want to find a stock that could multiply over the long term, what are the underlying trends we should look for? Amongst other things, we'll want to see two things; firstly, a growing return on capital employed (ROCE) and secondly, an expansion in the company's amount of capital employed. Ultimately, this demonstrates that it's a business that is reinvesting profits at increasing rates of return. So when we looked at CSE Global (SGX:544) and its trend of ROCE, we really liked what we saw.
We've found 21 US stocks that are forecast to pay a dividend yield of over 6% next year. See the full list for free.
Return On Capital Employed (ROCE): What Is It?
If you haven't worked with ROCE before, it measures the 'return' (pre-tax profit) a company generates from capital employed in its business. To calculate this metric for CSE Global, this is the formula:
Return on Capital Employed = Earnings Before Interest and Tax (EBIT) ÷ (Total Assets - Current Liabilities)
0.18 = S$54m ÷ (S$633m - S$333m) (Based on the trailing twelve months to December 2024).
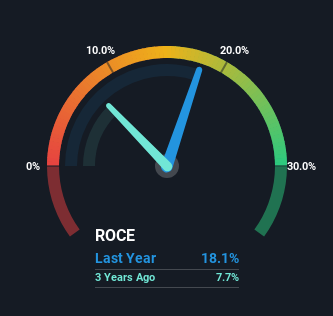
Thus, CSE Global has an ROCE of 18%. On its own, that's a standard return, however it's much better than the 13% generated by the IT industry.
View our latest analysis for CSE Global
Above you can see how the current ROCE for CSE Global compares to its prior returns on capital, but there's only so much you can tell from the past. If you'd like to see what analysts are forecasting going forward, you should check out our free analyst report for CSE Global .
The Trend Of ROCE
Investors would be pleased with what's happening at CSE Global. Over the last five years, returns on capital employed have risen substantially to 18%. Basically the business is earning more per dollar of capital invested and in addition to that, 36% more capital is being employed now too. This can indicate that there's plenty of opportunities to invest capital internally and at ever higher rates, a combination that's common among multi-baggers.
On a separate but related note, it's important to know that CSE Global has a current liabilities to total assets ratio of 53%, which we'd consider pretty high. This effectively means that suppliers (or short-term creditors) are funding a large portion of the business, so just be aware that this can introduce some elements of risk. While it's not necessarily a bad thing, it can be beneficial if this ratio is lower.
The Key Takeaway
To sum it up, CSE Global has proven it can reinvest in the business and generate higher returns on that capital employed, which is terrific. Considering the stock has delivered 38% to its stockholders over the last five years, it may be fair to think that investors aren't fully aware of the promising trends yet. Given that, we'd look further into this stock in case it has more traits that could make it multiply in the long term.
On a separate note, we've found 1 warning sign for CSE Global you'll probably want to know about.
For those who like to invest in solid companies, check out this free list of companies with solid balance sheets and high returns on equity.
New: AI Stock Screener & Alerts
Our new AI Stock Screener scans the market every day to uncover opportunities.
• Dividend Powerhouses (3%+ Yield)• Undervalued Small Caps with Insider Buying• High growth Tech and AI CompaniesOr build your own from over 50 metrics.
Explore Now for FreeHave feedback on this article? Concerned about the content? Get in touch with us directly. Alternatively, email editorial-team (at) simplywallst.com.This article by Simply Wall St is general in nature. We provide commentary based on historical data and analyst forecasts only using an unbiased methodology and our articles are not intended to be financial advice. It does not constitute a recommendation to buy or sell any stock, and does not take account of your objectives, or your financial situation. We aim to bring you long-term focused analysis driven by fundamental data. Note that our analysis may not factor in the latest price-sensitive company announcements or qualitative material. Simply Wall St has no position in any stocks mentioned.
Disclaimer: Investing carries risk. This is not financial advice. The above content should not be regarded as an offer, recommendation, or solicitation on acquiring or disposing of any financial products, any associated discussions, comments, or posts by author or other users should not be considered as such either. It is solely for general information purpose only, which does not consider your own investment objectives, financial situations or needs. TTM assumes no responsibility or warranty for the accuracy and completeness of the information, investors should do their own research and may seek professional advice before investing.
Most Discussed
- 1
- 2
- 3
- 4
- 5
- 6
- 7
- 8
- 9
- 10