ASX Penny Stock Spotlight: Bisalloy Steel Group Among 3 Noteworthy Picks
Amidst a turbulent week for global markets, with the ASX 200 futures indicating a significant drop due to international tariff tensions, investors are keenly observing how these macroeconomic events might impact smaller market segments. Despite their outdated moniker, penny stocks remain an intriguing investment area for those seeking potential growth and value in less-established companies. By focusing on firms with solid financial foundations, investors can uncover opportunities that offer both stability and potential upside; this article spotlights three such noteworthy penny stocks in Australia.
Top 10 Penny Stocks In Australia
| Name | Share Price | Market Cap | Rewards & Risks |
| CTI Logistics (ASX:CLX) | A$1.545 | A$120.53M | ✅ 4 ⚠️ 2 View Analysis > |
| Accent Group (ASX:AX1) | A$1.805 | A$1.02B | ✅ 4 ⚠️ 1 View Analysis > |
| EZZ Life Science Holdings (ASX:EZZ) | A$1.48 | A$69.82M | ✅ 4 ⚠️ 2 View Analysis > |
| IVE Group (ASX:IGL) | A$2.40 | A$370.78M | ✅ 4 ⚠️ 2 View Analysis > |
| GTN (ASX:GTN) | A$0.585 | A$114.88M | ✅ 3 ⚠️ 2 View Analysis > |
| Bisalloy Steel Group (ASX:BIS) | A$3.24 | A$153.74M | ✅ 3 ⚠️ 2 View Analysis > |
| Regal Partners (ASX:RPL) | A$2.16 | A$724.46M | ✅ 5 ⚠️ 3 View Analysis > |
| Southern Cross Electrical Engineering (ASX:SXE) | A$1.73 | A$457.19M | ✅ 4 ⚠️ 1 View Analysis > |
| NRW Holdings (ASX:NWH) | A$2.71 | A$1.24B | ✅ 5 ⚠️ 1 View Analysis > |
| LaserBond (ASX:LBL) | A$0.39 | A$45.76M | ✅ 3 ⚠️ 2 View Analysis > |
Click here to see the full list of 971 stocks from our ASX Penny Stocks screener.
Here's a peek at a few of the choices from the screener.
Bisalloy Steel Group (ASX:BIS)
Simply Wall St Financial Health Rating: ★★★★★★
Overview: Bisalloy Steel Group Limited manufactures and sells quenched and tempered, high-tensile, and abrasion-resistant steel plates in Australia, Indonesia, Thailand, and internationally with a market cap of A$153.74 million.
Operations: The company's revenue from Australia amounts to A$103.30 million, with a segment adjustment of A$43.84 million.
Market Cap: A$153.74M
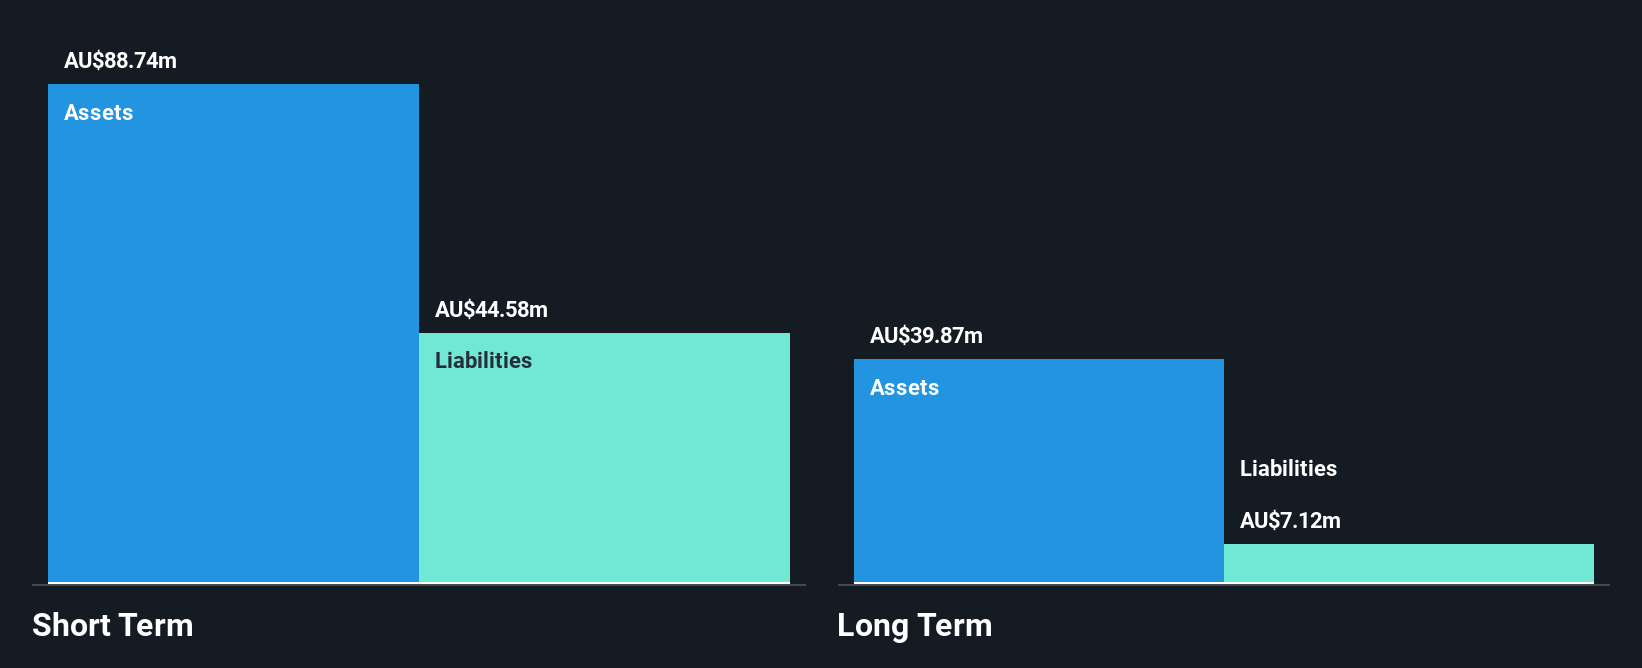
Bisalloy Steel Group has demonstrated solid financial health, with short-term assets exceeding both short and long-term liabilities, and a strong cash position surpassing its total debt. Recent earnings growth of 14% outpaced the industry average, supported by high-quality earnings and a robust return on equity of 21.7%. The company's interest payments are well covered by EBIT, indicating financial stability. Despite a slight decline in sales for the half-year ending December 2024 compared to the previous year, net income improved slightly. However, Bisalloy's dividend history remains unstable despite recent affirmations of dividends.
- Dive into the specifics of Bisalloy Steel Group here with our thorough balance sheet health report.
- Learn about Bisalloy Steel Group's future growth trajectory here.
Emerald Resources (ASX:EMR)
Simply Wall St Financial Health Rating: ★★★★★☆
Overview: Emerald Resources NL is involved in the exploration and development of mineral reserves in Cambodia and Australia, with a market cap of A$2.53 billion.
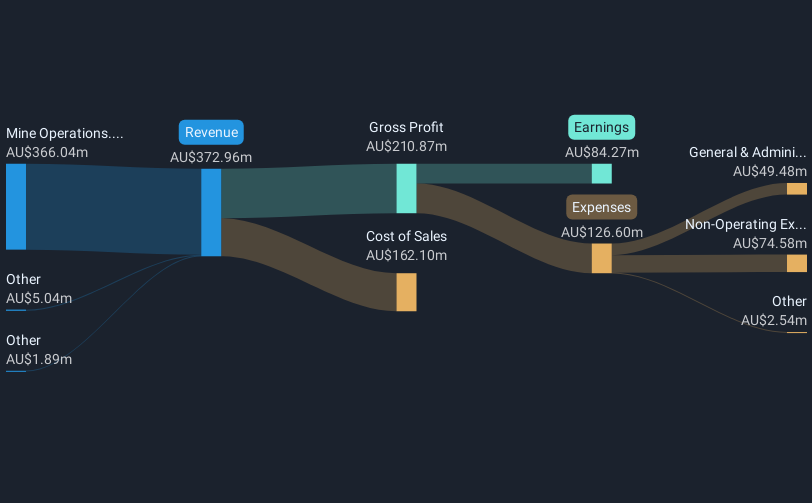
Operations: The company generates revenue primarily from its mine operations, amounting to A$427.32 million.
Market Cap: A$2.53B
Emerald Resources has shown robust financial performance, with recent earnings growth of 32.2% surpassing the industry average and a solid net profit margin improvement to 23.2%. The company reported record gold production at its Okvau Gold Mine, exceeding guidance and contributing to increased cash reserves of A$243 million. Its short-term assets comfortably cover both short and long-term liabilities, while operating cash flow effectively covers debt obligations. Despite a low return on equity of 15.6%, Emerald's seasoned management team has maintained shareholder value without significant dilution over the past year, supporting future growth prospects in the metals sector.
- Click here to discover the nuances of Emerald Resources with our detailed analytical financial health report.
- Gain insights into Emerald Resources' future direction by reviewing our growth report.
Locality Planning Energy Holdings (ASX:LPE)
Simply Wall St Financial Health Rating: ★★★★★★
Overview: Locality Planning Energy Holdings Limited offers energy solutions across Queensland and Northern New South Wales, with a market cap of A$24.92 million.
Operations: The company's revenue is derived entirely from its Energy Retail segment, amounting to A$42.61 million.
Market Cap: A$24.92M
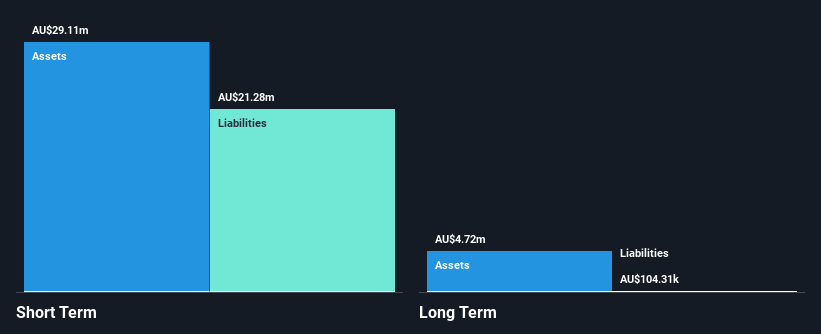
Locality Planning Energy Holdings has recently achieved profitability, with net income for the half-year ending December 2024 reaching A$1.64 million, a substantial increase from the previous year. The company has successfully reduced its debt to equity ratio significantly over five years and now holds more cash than total debt, indicating strong financial health. Its short-term assets exceed liabilities, providing a solid liquidity position. Recent board changes have brought in experienced directors like Craig Chambers to guide strategic growth amidst industry transitions. Despite management's relatively short tenure, LPE's operational improvements and earnings guidance suggest continued focus on enhancing profitability and market presence in Australia's energy sector.
- Jump into the full analysis health report here for a deeper understanding of Locality Planning Energy Holdings.
- Learn about Locality Planning Energy Holdings' historical performance here.
Turning Ideas Into Actions
- Reveal the 971 hidden gems among our ASX Penny Stocks screener with a single click here.
- Ready For A Different Approach? Explore 21 top quantum computing companies leading the revolution in next-gen technology and shaping the future with breakthroughs in quantum algorithms, superconducting qubits, and cutting-edge research.
This article by Simply Wall St is general in nature. We provide commentary based on historical data and analyst forecasts only using an unbiased methodology and our articles are not intended to be financial advice. It does not constitute a recommendation to buy or sell any stock, and does not take account of your objectives, or your financial situation. We aim to bring you long-term focused analysis driven by fundamental data. Note that our analysis may not factor in the latest price-sensitive company announcements or qualitative material. Simply Wall St has no position in any stocks mentioned.
If you're looking to trade Locality Planning Energy Holdings, open an account with the lowest-cost platform trusted by professionals, Interactive Brokers.
With clients in over 200 countries and territories, and access to 160 markets, IBKR lets you trade stocks, options, futures, forex, bonds and funds from a single integrated account.
Enjoy no hidden fees, no account minimums, and FX conversion rates as low as 0.03%, far better than what most brokers offer.
Sponsored ContentNew: AI Stock Screener & Alerts
Our new AI Stock Screener scans the market every day to uncover opportunities.
• Dividend Powerhouses (3%+ Yield)• Undervalued Small Caps with Insider Buying• High growth Tech and AI CompaniesOr build your own from over 50 metrics.
Explore Now for FreeHave feedback on this article? Concerned about the content? Get in touch with us directly. Alternatively, email editorial-team@simplywallst.com
Disclaimer: Investing carries risk. This is not financial advice. The above content should not be regarded as an offer, recommendation, or solicitation on acquiring or disposing of any financial products, any associated discussions, comments, or posts by author or other users should not be considered as such either. It is solely for general information purpose only, which does not consider your own investment objectives, financial situations or needs. TTM assumes no responsibility or warranty for the accuracy and completeness of the information, investors should do their own research and may seek professional advice before investing.
Most Discussed
- 1
- 2
- 3
- 4
- 5
- 6
- 7
- 8
- 9
- 10