Is Smurfit Westrock Plc (NYSE:SW) Trading At A 48% Discount?
Key Insights
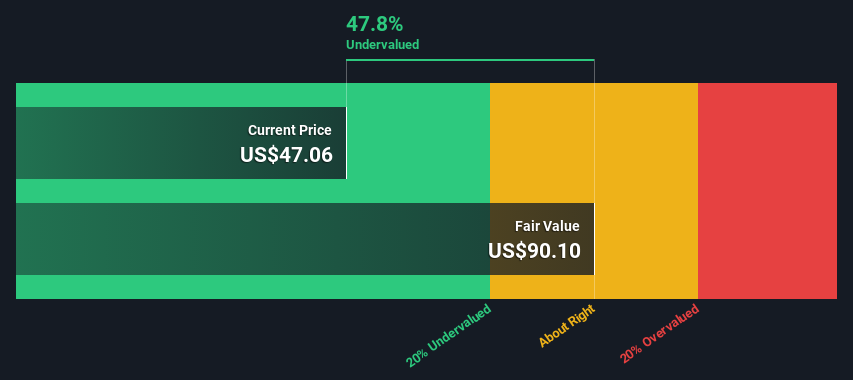
- The projected fair value for Smurfit Westrock is US$90.10 based on 2 Stage Free Cash Flow to Equity
- Current share price of US$47.06 suggests Smurfit Westrock is potentially 48% undervalued
- The US$60.15 analyst price target for SW is 33% less than our estimate of fair value
Today we will run through one way of estimating the intrinsic value of Smurfit Westrock Plc (NYSE:SW) by estimating the company's future cash flows and discounting them to their present value. Our analysis will employ the Discounted Cash Flow (DCF) model. There's really not all that much to it, even though it might appear quite complex.
Companies can be valued in a lot of ways, so we would point out that a DCF is not perfect for every situation. Anyone interested in learning a bit more about intrinsic value should have a read of the Simply Wall St analysis model.
We've found 21 US stocks that are forecast to pay a dividend yield of over 6% next year. See the full list for free.
Is Smurfit Westrock Fairly Valued?
We are going to use a two-stage DCF model, which, as the name states, takes into account two stages of growth. The first stage is generally a higher growth period which levels off heading towards the terminal value, captured in the second 'steady growth' period. To begin with, we have to get estimates of the next ten years of cash flows. Where possible we use analyst estimates, but when these aren't available we extrapolate the previous free cash flow (FCF) from the last estimate or reported value. We assume companies with shrinking free cash flow will slow their rate of shrinkage, and that companies with growing free cash flow will see their growth rate slow, over this period. We do this to reflect that growth tends to slow more in the early years than it does in later years.
A DCF is all about the idea that a dollar in the future is less valuable than a dollar today, so we need to discount the sum of these future cash flows to arrive at a present value estimate:
10-year free cash flow (FCF) estimate
| 2025 | 2026 | 2027 | 2028 | 2029 | 2030 | 2031 | 2032 | 2033 | 2034 | |
| Levered FCF ($, Millions) | US$1.68b | US$2.20b | US$2.50b | US$3.34b | US$3.12b | US$3.01b | US$2.96b | US$2.95b | US$2.97b | US$3.01b |
| Growth Rate Estimate Source | Analyst x9 | Analyst x9 | Analyst x6 | Analyst x2 | Analyst x1 | Est @ -3.53% | Est @ -1.65% | Est @ -0.33% | Est @ 0.60% | Est @ 1.24% |
| Present Value ($, Millions) Discounted @ 7.8% | US$1.6k | US$1.9k | US$2.0k | US$2.5k | US$2.1k | US$1.9k | US$1.7k | US$1.6k | US$1.5k | US$1.4k |
("Est" = FCF growth rate estimated by Simply Wall St)Present Value of 10-year Cash Flow (PVCF) = US$18b
We now need to calculate the Terminal Value, which accounts for all the future cash flows after this ten year period. For a number of reasons a very conservative growth rate is used that cannot exceed that of a country's GDP growth. In this case we have used the 5-year average of the 10-year government bond yield (2.8%) to estimate future growth. In the same way as with the 10-year 'growth' period, we discount future cash flows to today's value, using a cost of equity of 7.8%.
Terminal Value (TV)= FCF2034 × (1 + g) ÷ (r – g) = US$3.0b× (1 + 2.8%) ÷ (7.8%– 2.8%) = US$61b
Present Value of Terminal Value (PVTV)= TV / (1 + r)10= US$61b÷ ( 1 + 7.8%)10= US$29b
The total value is the sum of cash flows for the next ten years plus the discounted terminal value, which results in the Total Equity Value, which in this case is US$47b. In the final step we divide the equity value by the number of shares outstanding. Compared to the current share price of US$47.1, the company appears quite good value at a 48% discount to where the stock price trades currently. The assumptions in any calculation have a big impact on the valuation, so it is better to view this as a rough estimate, not precise down to the last cent.
Important Assumptions
The calculation above is very dependent on two assumptions. The first is the discount rate and the other is the cash flows. You don't have to agree with these inputs, I recommend redoing the calculations yourself and playing with them. The DCF also does not consider the possible cyclicality of an industry, or a company's future capital requirements, so it does not give a full picture of a company's potential performance. Given that we are looking at Smurfit Westrock as potential shareholders, the cost of equity is used as the discount rate, rather than the cost of capital (or weighted average cost of capital, WACC) which accounts for debt. In this calculation we've used 7.8%, which is based on a levered beta of 0.991. Beta is a measure of a stock's volatility, compared to the market as a whole. We get our beta from the industry average beta of globally comparable companies, with an imposed limit between 0.8 and 2.0, which is a reasonable range for a stable business.
Check out our latest analysis for Smurfit Westrock
SWOT Analysis for Smurfit Westrock
- Debt is well covered by earnings.
- Balance sheet summary for SW.
- Earnings declined over the past year.
- Dividend is low compared to the top 25% of dividend payers in the Packaging market.
- Shareholders have been diluted in the past year.
- Annual earnings are forecast to grow faster than the American market.
- Trading below our estimate of fair value by more than 20%.
- Debt is not well covered by operating cash flow.
- Dividends are not covered by cash flow.
- Revenue is forecast to grow slower than 20% per year.
- Is SW well equipped to handle threats?
Moving On:
Whilst important, the DCF calculation is only one of many factors that you need to assess for a company. The DCF model is not a perfect stock valuation tool. Preferably you'd apply different cases and assumptions and see how they would impact the company's valuation. If a company grows at a different rate, or if its cost of equity or risk free rate changes sharply, the output can look very different. Why is the intrinsic value higher than the current share price? For Smurfit Westrock, there are three further items you should further research:
- Risks: Be aware that Smurfit Westrock is showing 6 warning signs in our investment analysis , and 2 of those are potentially serious...
- Management:Have insiders been ramping up their shares to take advantage of the market's sentiment for SW's future outlook? Check out our management and board analysis with insights on CEO compensation and governance factors.
- Other Solid Businesses: Low debt, high returns on equity and good past performance are fundamental to a strong business. Why not explore our interactive list of stocks with solid business fundamentals to see if there are other companies you may not have considered!
PS. The Simply Wall St app conducts a discounted cash flow valuation for every stock on the NYSE every day. If you want to find the calculation for other stocks just search here.
If you're looking to trade Smurfit Westrock, open an account with the lowest-cost platform trusted by professionals, Interactive Brokers.
With clients in over 200 countries and territories, and access to 160 markets, IBKR lets you trade stocks, options, futures, forex, bonds and funds from a single integrated account.
Enjoy no hidden fees, no account minimums, and FX conversion rates as low as 0.03%, far better than what most brokers offer.
Sponsored ContentNew: Manage All Your Stock Portfolios in One Place
We've created the ultimate portfolio companion for stock investors, and it's free.
• Connect an unlimited number of Portfolios and see your total in one currency• Be alerted to new Warning Signs or Risks via email or mobile• Track the Fair Value of your stocks
Try a Demo Portfolio for FreeHave feedback on this article? Concerned about the content? Get in touch with us directly. Alternatively, email editorial-team (at) simplywallst.com.This article by Simply Wall St is general in nature. We provide commentary based on historical data and analyst forecasts only using an unbiased methodology and our articles are not intended to be financial advice. It does not constitute a recommendation to buy or sell any stock, and does not take account of your objectives, or your financial situation. We aim to bring you long-term focused analysis driven by fundamental data. Note that our analysis may not factor in the latest price-sensitive company announcements or qualitative material. Simply Wall St has no position in any stocks mentioned.
Disclaimer: Investing carries risk. This is not financial advice. The above content should not be regarded as an offer, recommendation, or solicitation on acquiring or disposing of any financial products, any associated discussions, comments, or posts by author or other users should not be considered as such either. It is solely for general information purpose only, which does not consider your own investment objectives, financial situations or needs. TTM assumes no responsibility or warranty for the accuracy and completeness of the information, investors should do their own research and may seek professional advice before investing.
Most Discussed
- 1
- 2
- 3
- 4
- 5
- 6
- 7
- 8
- 9
- 10