Investors Shouldn't Be Too Comfortable With Nam Cheong's (SGX:1MZ) Earnings
Nam Cheong Limited's (SGX:1MZ) robust earnings report didn't manage to move the market for its stock. Our analysis suggests that this might be because shareholders have noticed some concerning underlying factors.
Check out our latest analysis for Nam Cheong
Zooming In On Nam Cheong's Earnings
As finance nerds would already know, the accrual ratio from cashflow is a key measure for assessing how well a company's free cash flow (FCF) matches its profit. To get the accrual ratio we first subtract FCF from profit for a period, and then divide that number by the average operating assets for the period. This ratio tells us how much of a company's profit is not backed by free cashflow.
That means a negative accrual ratio is a good thing, because it shows that the company is bringing in more free cash flow than its profit would suggest. That is not intended to imply we should worry about a positive accrual ratio, but it's worth noting where the accrual ratio is rather high. Notably, there is some academic evidence that suggests that a high accrual ratio is a bad sign for near-term profits, generally speaking.
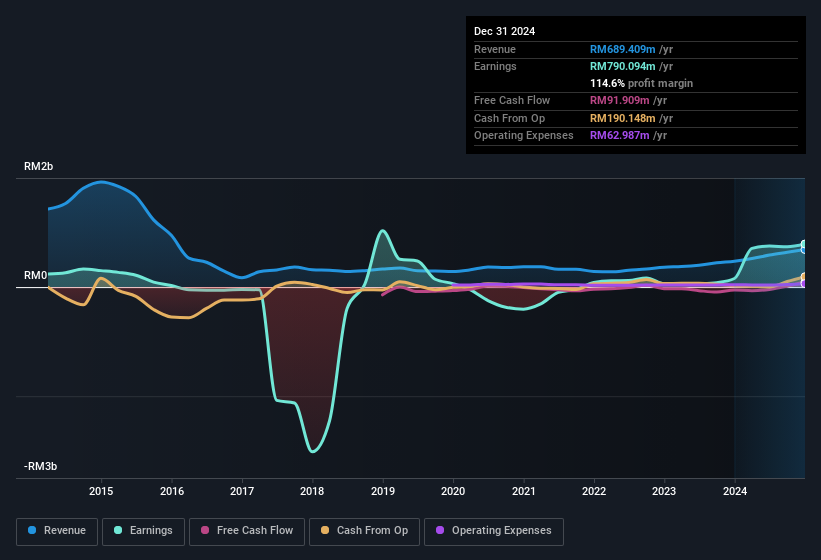
Over the twelve months to December 2024, Nam Cheong recorded an accrual ratio of 1.00. That means it didn't generate anywhere near enough free cash flow to match its profit. As a general rule, that bodes poorly for future profitability. In fact, it had free cash flow of RM92m in the last year, which was a lot less than its statutory profit of RM790.1m. Given that Nam Cheong had negative free cash flow in the prior corresponding period, the trailing twelve month resul of RM92m would seem to be a step in the right direction.
Note: we always recommend investors check balance sheet strength. Click here to be taken to our balance sheet analysis of Nam Cheong.
Our Take On Nam Cheong's Profit Performance
As we have made quite clear, we're a bit worried that Nam Cheong didn't back up the last year's profit with free cashflow. As a result, we think it may well be the case that Nam Cheong's underlying earnings power is lower than its statutory profit. But on the bright side, its earnings per share have grown at an extremely impressive rate over the last three years. The goal of this article has been to assess how well we can rely on the statutory earnings to reflect the company's potential, but there is plenty more to consider. So while earnings quality is important, it's equally important to consider the risks facing Nam Cheong at this point in time. Every company has risks, and we've spotted 3 warning signs for Nam Cheong (of which 1 can't be ignored!) you should know about.
This note has only looked at a single factor that sheds light on the nature of Nam Cheong's profit. But there are plenty of other ways to inform your opinion of a company. For example, many people consider a high return on equity as an indication of favorable business economics, while others like to 'follow the money' and search out stocks that insiders are buying. So you may wish to see this free collection of companies boasting high return on equity, or this list of stocks with high insider ownership.
Valuation is complex, but we're here to simplify it.
Discover if Nam Cheong might be undervalued or overvalued with our detailed analysis, featuring fair value estimates, potential risks, dividends, insider trades, and its financial condition.
Access Free AnalysisHave feedback on this article? Concerned about the content? Get in touch with us directly. Alternatively, email editorial-team (at) simplywallst.com.This article by Simply Wall St is general in nature. We provide commentary based on historical data and analyst forecasts only using an unbiased methodology and our articles are not intended to be financial advice. It does not constitute a recommendation to buy or sell any stock, and does not take account of your objectives, or your financial situation. We aim to bring you long-term focused analysis driven by fundamental data. Note that our analysis may not factor in the latest price-sensitive company announcements or qualitative material. Simply Wall St has no position in any stocks mentioned.
Disclaimer: Investing carries risk. This is not financial advice. The above content should not be regarded as an offer, recommendation, or solicitation on acquiring or disposing of any financial products, any associated discussions, comments, or posts by author or other users should not be considered as such either. It is solely for general information purpose only, which does not consider your own investment objectives, financial situations or needs. TTM assumes no responsibility or warranty for the accuracy and completeness of the information, investors should do their own research and may seek professional advice before investing.
Most Discussed
- 1
- 2
- 3
- 4
- 5
- 6
- 7
- 8
- 9
- 10