VO: Mid All Over

olaser/E+ via Getty Images
Mid-caps and the Vanguard Mid-Cap ETF (NYSEARCA:VO) have delivered a performance in 2024 that can only be described as mid. Returns are better than small caps (VB), but lagging the S&P 500 (SPY) and significantly lagging mega caps (MGC).
However, that has recently changed and VO is leading the pack in H2. This article looks at why, and whether it can be expected to last.
Introducing VO
VO is a passively managed fund which seeks to track the CRSP US Mid Cap Index, which measures the investment return of mid-cap stocks.
There is not much literature on how the underlying Index is composed, and the CRSP site merely mentions that, "Targets U.S. companies that fall between the top 70%-85% of investable market capitalization."
This graphic is from the CRSP July report which shows the market caps involved.
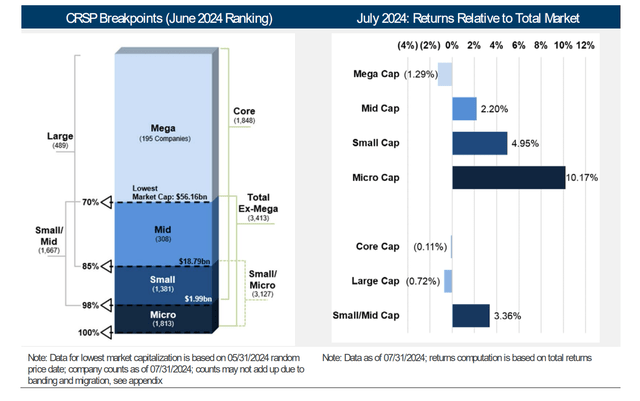
Cap Indices (CRSP)
The CRSP US Mid Cap Index is one of four mid-cap focused Indices summarized below.
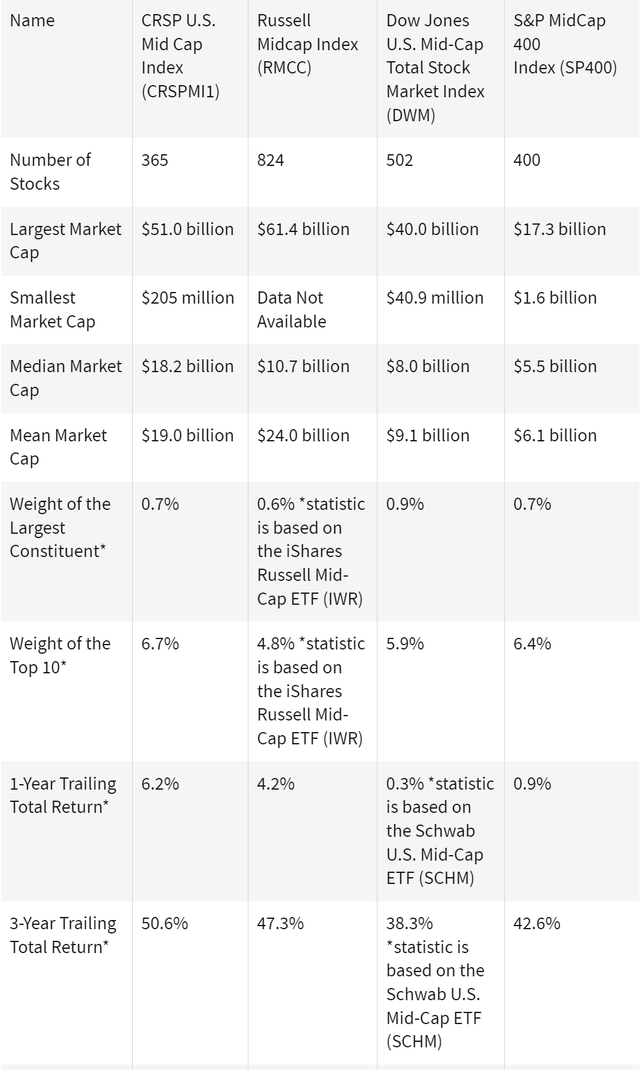
Mid-Caps (Investopedia)
There are only subtle differences, but it seems the lower amount of holdings and resultant higher concentration in the top 10 leads to a slight outperformance; a positive for VO. The fund also has a heavier weighting in technology when industrials are usually the top sector in mid caps.
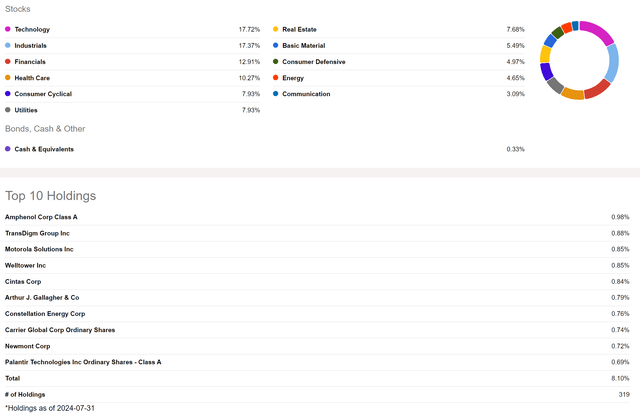
VO Exposure (Seeking Alpha)
The Schwab US Mid-Cap ETF (SCHM), for instance, has a 15% weighting in technology and nearly 20% in industrials.
VO has a very low expense ratio of 0.04%, which is matched by SCHM, though its total returns lag over the 1-year and 5-year periods.
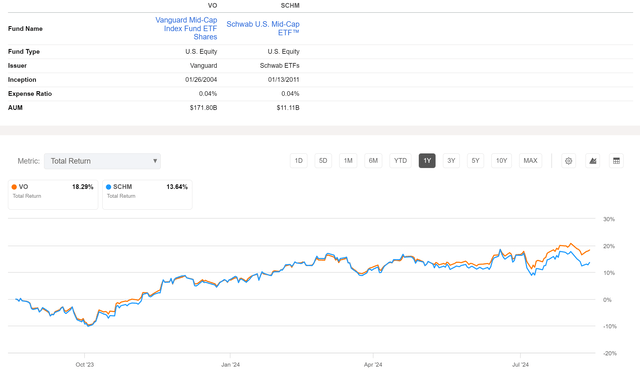
VO v SCHM (Seeking Alpha)
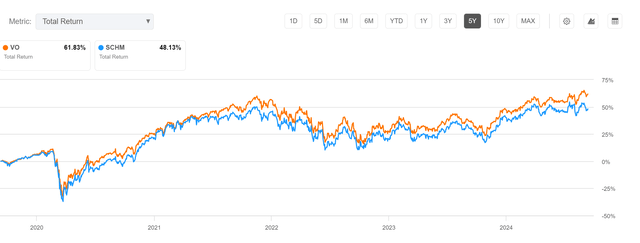
VO v SCHM (Seeking Alpha)
With its large AUM of $171B, low expense ratio and solid performance, VO is one of the leading funds in the mid-cap space. It is also interesting as the fund sponsor Vanguard has comparable funds in the small cap and mega cap space. It even has a S&P 500 proxy, the Vanguard S&P 500 ETF (VOO). This allows an easy comparison of funds and aids in the search for alpha.
Rare Outperformance
VO has underperformed the broader market for a long time, with only brief periods of relative strength. This is clear on a VO/VOO chart which is trending strongly lower. However, it is notable that the current bounce is the largest since 2020-2021.
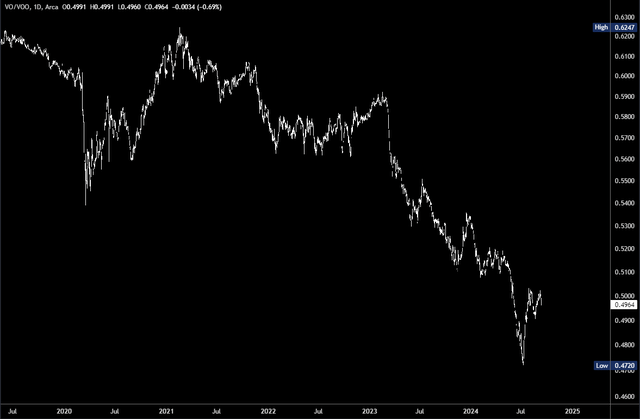
VO/VOO (Tradingview)
VO/MGC shows VO is also outperforming mega caps in recent months.
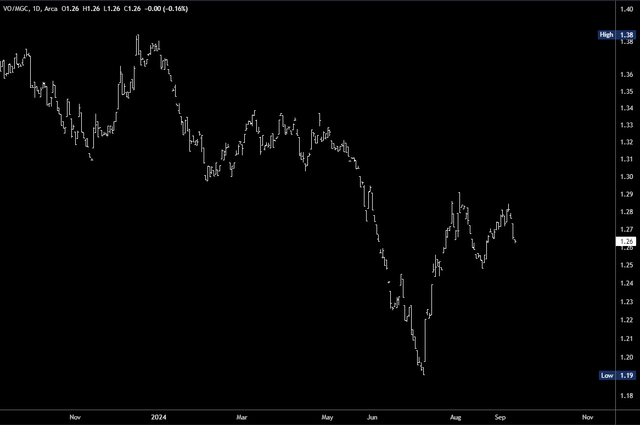
VO/MGC (Tradingview)
Encouraging as this is, the relative strength comes more from weakness in VOO and MGC rather than anything impressive from VO. Mega cap stocks such as Nvidia (NVDA) and sectors such as technology are taking a much needed rest to compress multiples. MGC has a PE ratio of 27.9, while VOO sits at 26.6.
VO is more attractive at 22.6, but its earnings growth rate is only 13.8% compared to MGC's 18.5%. In other words, its multiple is lower for a good reason and hardly a major reason to dump MGC to buy VO.
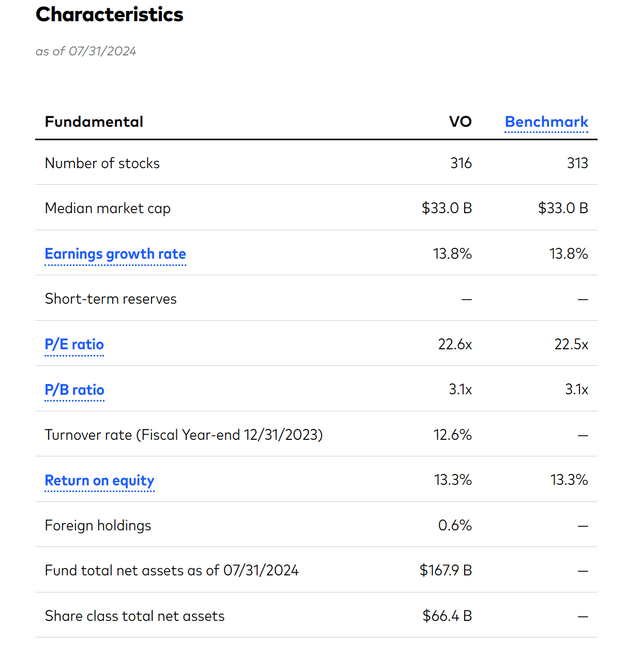
VO Characteristics (Vanguard)
13.8% earnings growth is solid enough, but VO has rallied nearly 40% from the October 2023 low and there doesn't seem potential for much more. This is seen on VO's chart - it made a new 2024 high on August 30, but fell back again and the rally since March has been a case of two steps forward and one step back.
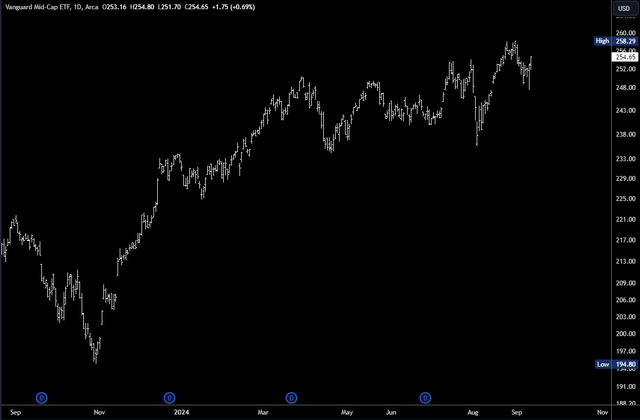
VO Daily Chart (Tradingview)
VO may hold up better than VOO and MGC during this corrective period, but is not likely to consistently outperform unless the strength in technology completely reverses. Given the long-term trend and strong earnings, this doesn't look likely.
Rotationally Favoured
Some tailwinds for VO have come from rotations in the last month. Real estate has been one of the best performing sectors and has a 7.68% weighting in VO and only 1.1% in MGC.
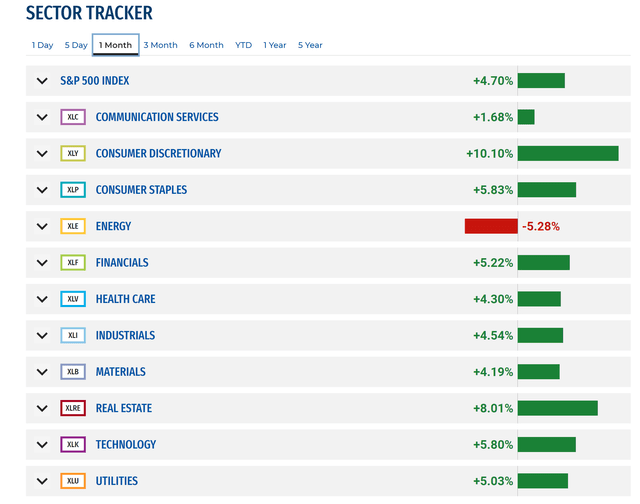
SPDR Sectors (State Street)
Indeed, mid-caps have the heaviest weighting in REITs out of all market cap indexes. It also has significantly more exposure to utilities.
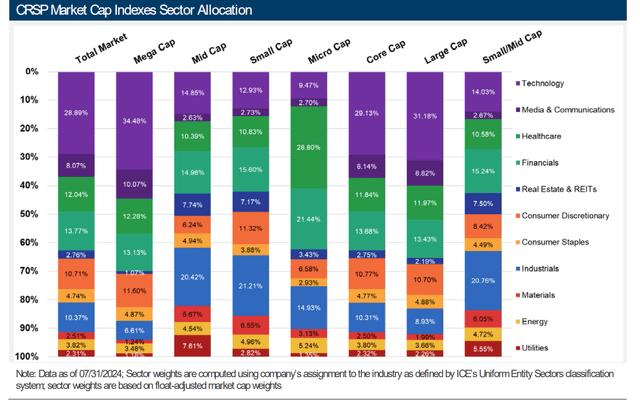
Sector Exposure (CRSP)
The prospect of rate cuts are a positive, especially for rate-sensitive REITs, and debt-laden utilities, but as the cuts are partly in response to a weaker economy rather than solely in response to lower inflation, the positive effects could be largely balanced out in other sectors. While it is too early to call a recession, there are definite signs of slowing in the economy and the labour market data is a concern. This isn't the ideal backdrop for VO with its large exposure to industrials.
In short, the sector exposure has been a positive in recent months, but you would need to be confident the outperformance in technology is going to be eclipsed by industrials, REITs and utilities to favor VO over VOO or MGC in the long-term.
Risks
Mid-caps carry greater risk and this is highlighted on the fund page.
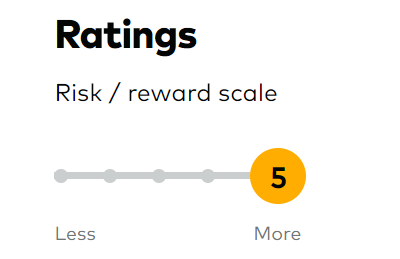
Risk (Vanguard)
The concern is the added risk does not lead to better returns. The table below (data from 2015) shows VO's Sortino ratio is low and the CAGR is in the single digits compared to 13.58% for MGC,
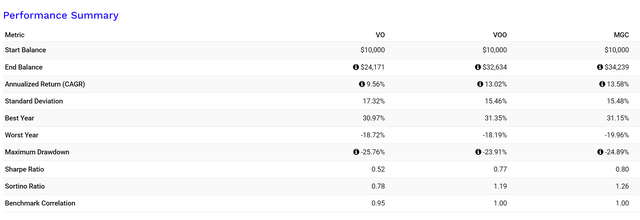
Performance Table (Portfolio Visualizer)
Larger drawdowns and lower returns are a factor nearly every year. It must be frustrating to hold and the divergence widened further in 2023.
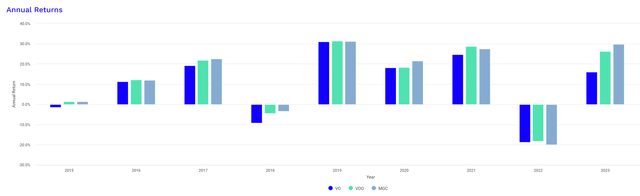
Annual Performance (Portfolio Visualizer)
Conclusions
VO is a decent fund in the mid-cap space. Its low expense ratio and returns are attractive. Furthermore, its performance since early July is also favorable compared to the broader market and mega-cap funds. However, I don't think there is enough evidence to say this is the start of a sustained outperformance and historical data for VO is disappointing. Poor risk-adjusted returns are a consistent feature over the last ten years and this could continue.
Disclaimer: Investing carries risk. This is not financial advice. The above content should not be regarded as an offer, recommendation, or solicitation on acquiring or disposing of any financial products, any associated discussions, comments, or posts by author or other users should not be considered as such either. It is solely for general information purpose only, which does not consider your own investment objectives, financial situations or needs. TTM assumes no responsibility or warranty for the accuracy and completeness of the information, investors should do their own research and may seek professional advice before investing.
Most Discussed
- 1
- 2
- 3
- 4
- 5
- 6
- 7
- 8
- 9
- 10