QQQ: My In-Depth Look At The Nasdaq-100 Fundamentals
FilippoBacci
Introduction
The Invesco QQQ Trust ETF (NASDAQ:QQQ) has gained 142.12% over the last five years, easily outperforming broad-market benchmarks like the SPDR® S&P 500® ETF Trust (SPY) and prompting several analysts to declare it's time to sell.
Morningstar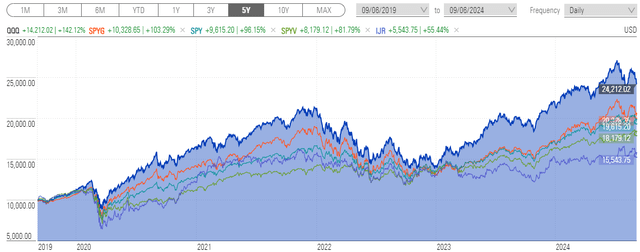
However, I don't think it's that simple. First, some analysts misinterpret how data providers calculate valuation ratios for ETFs, which sadly leads to irrelevant apples-to-oranges comparisons. Second, assessing valuation should be more comprehensive than analyzing one ratio like P/E, as metrics like sales, cash flow, book value, and enterprise value also matter. Third, analysts often ignore factors that can justify a stock's premium valuation, which might include outstanding profitability, high-growth potential, consistent earnings beats, or, in the case of some defensive stocks, excellent downside protection.
It's the combination of all these known factors, plus many other unknown ones too, that help market participants determine price, and it's my goal today to synthesize this information for you to demonstrate that:
1. QQQ trades at a 21.4% premium on forward earnings compared to SPY but makes up for it with 4.17% more estimated one-year earnings per share growth (31.78% on a relative basis).
2. QQQ's constituents are generally more profitable than SPY's, including net margins that are 0.61% better and a sector-adjusted profit score that ranks #39/932 among all U.S. Equity ETFs I track.
3. Wall Street analysts are still generally bullish on QQQ's holdings, but recent earnings surprise results suggest that might change soon.
These are some metrics I will use to explain that when it comes to assessing whether QQQ is "overpriced" or "overvalued", it's complicated. My take is that market sentiment is shifting away from growth stocks, so it's prudent to diversify with high-quality value and defensive stocks. Still, declaring QQQ is an obvious sell does not make much sense to me, and I look forward to illustrating why in more detail below.
ETF Valuations: Challenges And Pitfalls
Data providers calculate valuation ratios in different ways. A portfolio's price-earnings ratio is a commonly used metric, as are price-sales, price-cash flow, and price-book ratios. A valuation analyst might also examine enterprise value to sales and enterprise value to EBITDA to reduce biases that arise from companies' differing capital structures or even to include more companies if earnings per share are negative. As a large-cap fund, that's not much of a risk with QQQ since only 12/100 stocks (3.55% of the portfolio by weight) have negative one-year trailing earnings per share, and even less (2/100 stocks, 0.33% by weight) have negative estimated one-year earnings per share. However, most would agree using several valuation ratios is prudent.
According to Morningstar, QQQ traded at 27.86x earnings as of September 4, 2024, which was a few points less than the large-cap growth category average of 30.24x as of July 31, 2024. It also had a 6.57x price-book ratio, a 4.93x price-sales ratio, and a 17.96x price-cash flow ratio. Morningstar's data definitions clarify these are forward-looking metrics. However, an analyst might also be interested in trailing metrics, especially for well-established companies where actual results could mean more than Wall Street analyst expectations. Again, it's a good idea to consider both.
Morningstar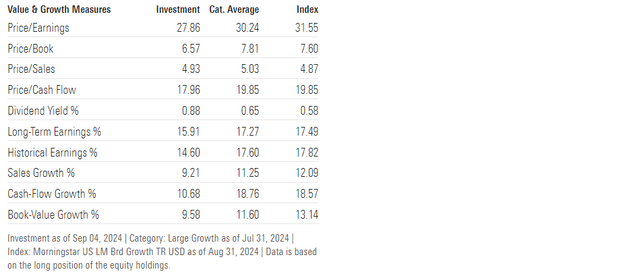
Effective November 30, 2005, Morningstar switched from an arithmetic weighted average method to a harmonic weighted average method when calculating portfolio valuation ratios. With this announcement, the data provider argued the latter does a better job of preventing outliers from skewing results. As an analyst performing these calculations independently for nearly 1,000 U.S. Equity ETFs, I can say that dealing with outliers is incredibly important because if you do it wrong, you'll likely mislead the end-user. For example, Vertex Pharmaceuticals Incorporated (VRTX) trades at 2,772.35x forward earnings and has a 0.86% weight in QQQ. I won't let such an irrelevant stock influence the portfolio's valuation much, so I cap the valuation at 60, as does Morningstar. The difference between the uncapped and capped forward P/E ratios is relatively small as of September 6, 2024 (27.18x vs. 26.89x), but think about how necessary this was last year when Amazon.com, Inc. (AMZN) was trading above 300x trailing earnings. Although not in QQQ, comparing its P/E against an uncapped P/E for SPY would produce misleading results.
Another mistake is comparing a harmonic weighted P/E with an arithmetic weighted P/E, as the latter will always be equal or higher. For example, QQQ's capped arithmetic forward P/E is 31.68x compared to 26.89x under the harmonic weighted average method. You might also unknowingly compare a fund's trailing P/E from one data provider with the forward P/E from another, so my advice is to be extremely careful. It's easy to make these mistakes, which can be costly.
Lastly, even though Morningstar uses reasonable techniques to control the influence of outliers, like limiting a stock's P/E to 60 and switching to the harmonic weighted average method nearly 20 years ago, it's still an imperfect process. First, while a stock's price is never in doubt, its estimated earnings are, and it might even be unclear whether the data provider uses GAAP or non-GAAP earnings in the denominator. Second, Morningstar only requires 50% of the portfolio's components by weight to have positive earnings. That's a pretty low bar. To illustrate, did you know that only 79.57% of holdings by weight in the iShares Russell 2000 Value ETF (IWN) have positive estimated one-year earnings per share and only 74.76% on a trailing one-year basis? As a result, its 12.78x forward P/E comes with a quality caveat analysts often ignore. If one were to apply the 60 cap to the non-profitable stocks, IWN's valuation would jump to 15.23x, a 19% difference.
To summarize, evaluating an ETF's valuation can be complex, but there are a few simple things you can do to reduce the chances of being misled, including:
1. Use a single data provider like Morningstar. Statistics like a portfolio's forward P/E ratio are provided using a consistent process for all ETFs.
2. Question significant discrepancies and read the footnotes. For example, QQQ's fact sheet notes a 38.88x P/E ratio, but the glossary confirms this is on a trailing basis. Furthermore, this is most likely based on GAAP earnings, and my analysis suggests Invesco did not control for outliers. Therefore, comparing Invesco and Morningstar valuation ratios is not appropriate.
3. Evaluate a portfolio's valuation alongside its quality. As a rule of thumb, large-cap stocks are typically profitable, and thus, the data provider likely included most holdings in the calculation. However, it's trickier with small caps. Morningstar does not highlight profitability metrics like return on equity but includes "quality" in its factor profile chart. The valuation metrics are probably reasonable if it's high on the quality scale, but if it's too low, the valuation ratios presented are likely understated.
Morningstar
I went into more depth here than I anticipated because I want readers to understand data providers' challenges when valuing ETFs. Based on my experience, there's no substitute for calculating the metrics yourself and seeing the impact constraints can have on the results. Ultimately, it's about trying to present something that's reasonable, transparent, useful, and consistent, so for full disclosure, below is a summary of the data sources and constraints I use when calculating portfolio fundamentals.
1. For value, my data source is Seeking Alpha. I use non-GAAP forward and trailing price-earnings ratios, trailing price-sales ratios, trailing price-cash flow ratios, and trailing price-book ratios. On occasion, I use trailing EV-EBITDA and trailing EV-Sales. Examples are here.
2. For growth, my data source is also Seeking Alpha. I rely primarily on diluted earnings per share growth and EBITDA growth rates. Examples are here.
3. I calculate valuation metrics using the harmonic weighted average method and growth metrics using the arithmetic weighted average method, consistent with Morningstar's approach.
4. I assign minimum and maximum values for each statistic to limit the influence of outliers. These constraints include:
- price-sales, price-cash flow, price-earnings: 0 to 60.
- price-book: 0 to 30.
- growth rates, sales/earnings surprises: -50% to 50%.
- margins (gross, EBITDA, EBIT, free cash flow, net): -100% to 100%.
- beta: -3 to 3.
5. In most cases, I extract ETF holdings directly from the fund provider and adjust for cash and other non-equity holdings. I use third-party websites in rare cases, such as with lesser-known funds.
I hope this information will give you some confidence that the numbers I'm about to present for QQQ and other ETFs were carefully calculated and accurate to the best of my ability. With that said, let's dive into the analysis.
QQQ Analysis
High-Level Fundamentals
The following table highlights selected fundamental metrics for QQQ's top 25 holdings, which total 71.38% of the portfolio. I've also included summary metrics for the SPDR® Portfolio S&P 500 Growth ETF (SPYG), the SPDR® S&P 500® ETF Trust (SPY), the SPDR® Portfolio S&P 500 Value ETF (SPYV), and the iShares Core S&P Small-Cap ETF (IJR) at the bottom. Have a quick scan of the results, and I'll provide some high-level commentary afterward.
The Sunday Investor
I create these tables for all the ETFs I analyze because it's comprehensive. Along with the company name and weight, we have data covering the diversification, size, volatility, growth, valuation, momentum, quality, and sentiment factors. For example, we can quickly tell:
1. QQQ has a weighted average market cap of $1.1 billion, which is in between SPY and SPYG. It indicates mega-cap stocks are prominent in QQQ, but perhaps not as much as with dedicated growth funds. A quick composition analysis of its top ten holdings vs. SPYG and SPY confirms this. Note how QQQ underweights Apple Inc. (AAPL), Microsoft Corporation (MSFT), and NVIDIA Corporation (NVDA) by 3% or more compared to SPYG but overweights them by 1-2% vs. SPY.
The Sunday Investor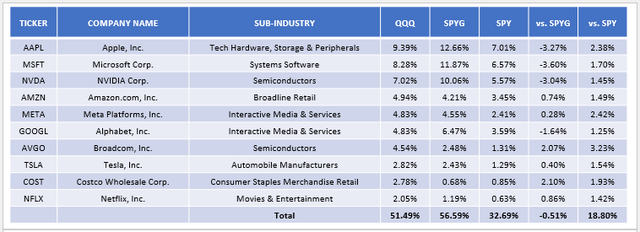
2. QQQ's holdings have a 1.14 weighted average five-year beta, slightly less than SPYG's 1.16 but less than SPY's 1.05 figure. SPYV's 0.90 five-year beta indicates its holdings are less volatile than the broader market, while the small-cap stocks in IJR are the most volatile, as is typical for the segment.
3. QQQ has a weighted average of 12.28% and 17.31% estimated one-year sales and earnings per share growth rate, which falls between SPY and SPYG. QQQ trades at 21.29x trailing cash flow and 26.89x forward earnings, which are also between SPY and SPYG. GARP investors might consider dividing each ETF's forward P/E by its one-year estimated earnings per share growth rate to calculate a modified PEG ratio. The lower, the better, and the results are pretty similar for QQQ, SPYG, and SPY:
- QQQ: 26.89x / 17.31% / 100 = 1.55.
- SPYG: 27.94x / 19.22% / 100 = 1.45.
- SPY: 22.15x / 13.13% / 100 = 1.69.
- SPYV: 17.54x / 5.97% / 100 = 2.94.
- IJR: 14.68x / 4.21% / 100 = 3.49.
Based on these results, QQQ is looking pretty good. It's expensive but offers exceptional growth even after capping Nvidia's earnings growth rate at 50% from 128.64%. Using this metric, you could do a little better with SPYG, but remember that it's just one statistic, and your analysis shouldn't stop there.
4. If back-tested based on current weights, QQQ's constituents would show a 28.52% one-year price gain, compared to 34.99% and 27.78% for SPY and SPYG. Meanwhile, SPYV and IJR's figures are much lower, at 18.91% and 20.73%, respectively.
5. QQQ's quality is excellent, evidenced by its constituents' 21.61% weighted average net margins and 9.69/10 sector-adjusted profit score, which I derived from Seeking Alpha Factor Grades. Like with growth, you could do slightly better with SPYG, but we're splitting hairs here. QQQ, SPYG, and SPY are all high-quality funds. SPYV is worse, while IJR's quality deficiencies are apparent based on its 8.99% net margins and 5.99/10 profit score.
6. Seeking Alpha EPS Revision Grades are good sentiment indicators, as the inputs are actual consensus Wall Street analyst earnings changes. It's essential for me that this score aligns well with price momentum, as a disconnect would imply a market inefficiency. For example, it would be unusual for a stock to deliver substantial returns even as analysts downgrade earnings expectations, but fortunately for QQQ, there is no disconnect. Its 6.53/10 EPS Revision Score ranks #199/932 among all the U.S. Equity ETFs I track. Meanwhile, its momentum score ranks #196/932. I have confidence in Seeking Alpha's Momentum Grades because the top-ranked momentum funds, when re-calculated based on current holdings and weights, are exactly what you'd expect. The top five ETFs as of August 31, 2024, are:
- Invesco Dorsey Wright SmallCap Momentum ETF (DWAS).
- Vanguard U.S. Momentum Factor ETF ETF Shares (VFMO).
- Invesco S&P SmallCap Momentum ETF (XSMO).
- Invesco Dorsey Wright Utilities Momentum ETF (PUI).
- Invesco Dorsey Wright Consumer Staples Momentum ETF (PSL).
Overall, QQQ's results indicate its valuation is high but reasonable when compared to broad-market alternatives like SPY. Its 21.38% premium on forward earnings (26.89x vs. 22.15x) is at least partially justified with 4.17% more one-year estimated earnings growth (17.31% vs. 13.13%), or 31.78% more on a relative basis, leading to a superior PEG ratio (1.55x vs. 1.69x). The downside is it's riskier, based on its higher five-year beta, but perhaps its quality acts as an offset. Lastly, QQQ still has the edge on earnings revisions, implying Wall Street analysts still favor growth stocks over value stocks.
If Not QQQ, Then What Else?
QQQ bears should have suggestions on where else to put the proceeds of your QQQ sale. The only exception is if they advocate reducing your total position in equities, but that's an asset allocation decision that requires knowledge of your risk tolerance and investment objectives. I can't answer those questions, so for the time being, let's assume you want to sell QQQ and buy something else.
The problem is that most "something else's" aren't necessarily better. To illustrate, if you asked me to find you an alternative large-cap growth ETF with better value features, I would suggest these ten funds, sorted based on my value rankings vs. 932 funds as of August 31, 2024:
The Sunday Investor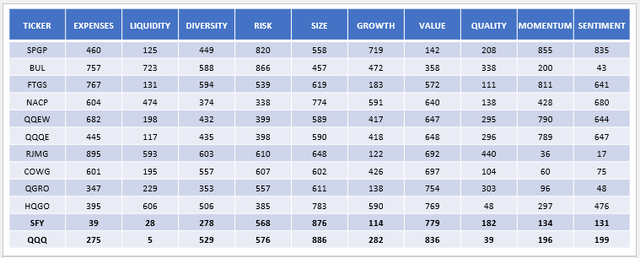
The Invesco S&P 500 GARP ETF (SPGP) unsurprisingly ranks much better than QQQ on the value factor (#142 vs. #836), but the sacrifices on other factors, like risk, growth, momentum, and sentiment, are substantial. Its expense ratio is also greater, so I'm not sure if it's a great choice. Instead, I'd probably steer you to a "growth light" fund like the SoFi Select 500 ETF (SFY), which features mild improvements in growth, value, and diversification, with an acceptable sacrifice on quality.
Alternatively, you could go to the opposite end of the spectrum and choose a high-quality large-cap value ETF. I assume this is what most QQQ bears would suggest, and for these investors, I'd suggest looking into these ten funds with high quality and value rankings:
The Sunday Investor
The problem with these selections is that you're going to have to make a quality sacrifice no matter what, even with the highest-quality choices like the iShares Core High Dividend ETF (HDV) or the VanEck Durable High Dividend ETF (DURA). In addition, most of these funds still have disastrous growth, momentum, and sentiment rankings, so I can't blame QQQ investors for sticking with what's worked so well over the years. Despite the numerous claims it's overpriced, QQQ's AUM has grown by $9.18 billion over the last three months, $5.00 billion of which was fund flows, with the remaining $4.18 billion due to price changes.
VettaFi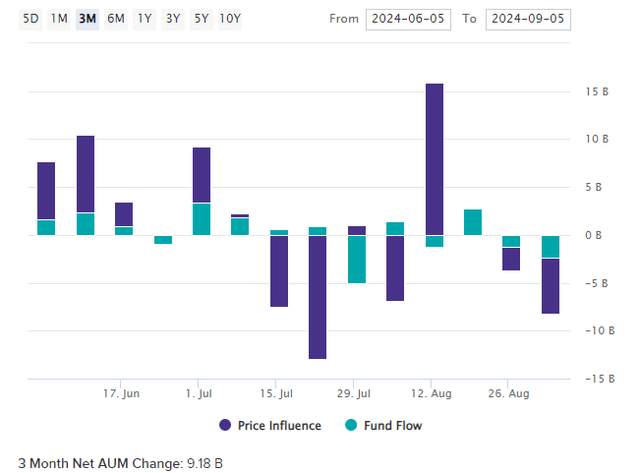
Tracking Market Sentiment
As the saying goes, the grass isn't always greener on the other side, but it appears the market is at a tipping point. The gap between EPS Revision Scores for growth and value ETFs has narrowed in recent months, and notably, QQQ's constituents delivered only a 4.82% weighted average earnings surprise last quarter compared to 7.10% for SPYV. Those figures were 7.85% and 6.48% two months ago, and while one month is not a trend, these results set the foundation for a rotation to value. Nvidia's surprise was particularly disappointing and was the lowest since October 2022.
Seeking Alpha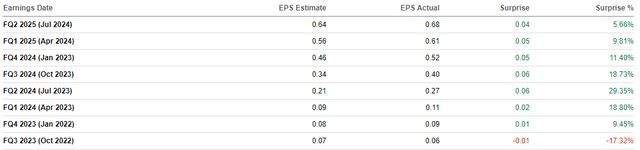
I mention this because earnings surprise changes have historically done a pretty good job predicting bear markets. To illustrate, below is an archived image of S&P 500 Index earnings surprises from 1987 to 2022, which I used in this Q1 2023 earnings season summary article. Notice how earnings surprises declined to nearly 0% in the early 2000s, aligning with the infamous tech crash. They were sharply negative during the Great Financial Crisis before turning positive again in 2009 when SPY gained 26%.
Yardeni Research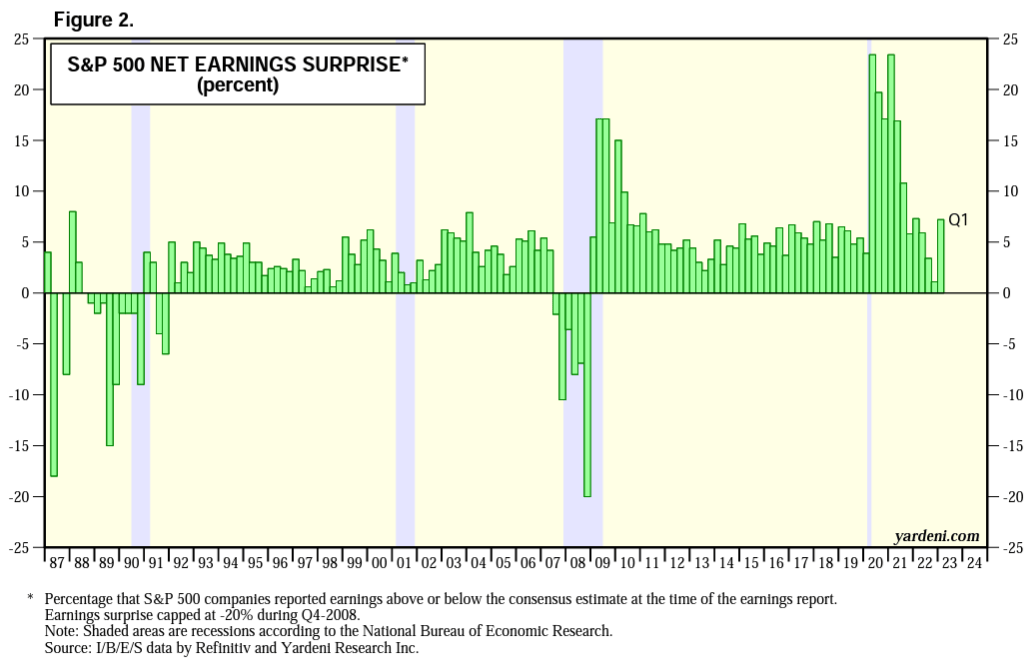
More recently, sudden changes also matter. Earnings surprises were in the double-digits for several consecutive quarters following the pandemic before stocks were re-valued in 2022, with an 18% decline for SPY. However, the potential for AI to transform our way of life has led to significant market enthusiasm and returns since 2023, which, for many, are tough to justify. As reported by FactSet in its Q2 2024 Earnings Insight Report:
In aggregate, companies are reporting earnings that are 3.6% above expectations. This surprise percentage is below the 1-year average (+6.5%), below the 5-year average (+8.6%), and below the 10-year average (+6.8%). Historical averages reflect actual results from all 500 companies, not the actual results from the percentage of companies that have reported through this point in time.
The S&P 500 Index's aggregate sales surprise of 0.7% is also below the 1.1%, 2.0%, and 1.4% one-year, five-year, and ten-year averages. The chart below tells the story well. Technology stocks, which have the most influence in SPY and comprise 50% of QQQ, delivered an earnings surprise of just 3.2%.
FactSet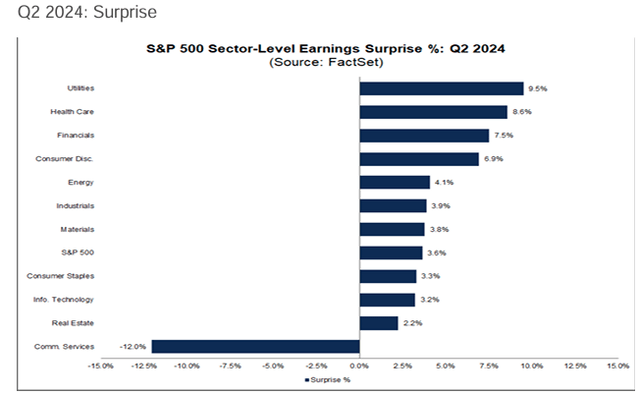
Instead, Utility stocks did with a 9.5% earnings surprise, followed by Health Care and Financials at 8.6% and 7.5%. In my view, this chart should concern QQQ shareholders. While it's just one quarter, the last time I saw a breakdown like this was in 2022. I made the right call with XLU in March 2022 when nearly every other analyst was bearish. Recently, I reasoned the sector's earnings surprise change from -8.6% to +5.7% from Q1 2023 to Q2 2023 justified buying VPU, and although I was too early, VPU has caught up to the S&P 500 Index's total returns since the article's publication.
Seeking Alpha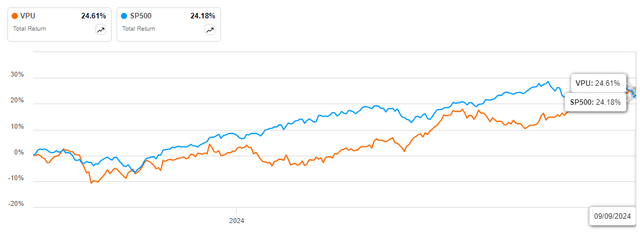
Still, we should give weight to how the top Nasdaq-100 stocks still beat earnings expectations last quarter. Tesla, Inc. (TSLA), Texas Instruments Incorporated (TXN), and Amgen Inc. (AMGN) were the key exceptions, but they comprise just 5.34% of the Index, which is hardly a signal to dump all your shares. Instead, a more guarded approach is required, and I think it's worth trying to improve your portfolio's risk and valuation rankings before the next earnings season. On that note, let's examine QQQ's value and growth features a little closer.
QQQ: High Valuation, High Growth (With A Catch)
The following table compares several valuation and growth metrics for QQQ, SPYG, SPY, SPYV, and IJR. I've bolded several sector-adjusted factor scores, which I derived from Seeking Alpha Factor Grades, and my first thought is that SPY is probably the easiest way to reduce your portfolio's risk and valuation without sacrificing too much on other factors. Past performance aside, it's a fundamentally solid ETF.
The Sunday Investor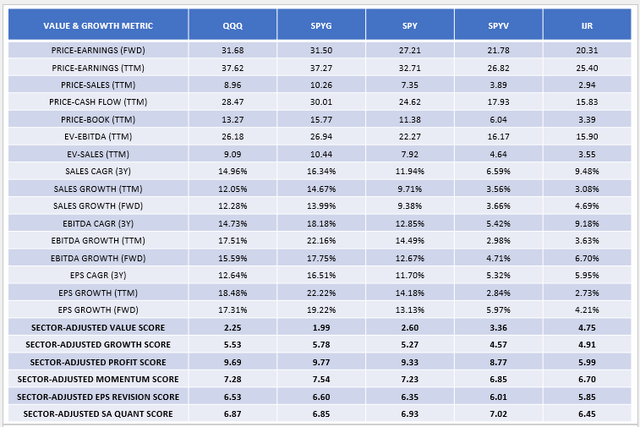
In QQQ's case, one concern is decelerating sales growth (one-year vs. three-year) but accelerating earnings per share growth. Increased operational efficiency and buybacks are likely sources, but there's a limit before companies can get "tapped out" or when buybacks no longer make sense (e.g., when share prices are too high).
On the other hand, QQQ's valuation ratios make sense when compared to these broad-market alternatives. The table above highlights seven ratios that are all higher than SPY's but lower than SPYG's. Therefore, if you want to make the case that QQQ is overpriced, that argument extends to pretty much every other large-cap growth ETF and even SPY, whose 2.60/10 value score ranks #716/932 among all the U.S. Equity ETFs I track.
QQQ: All Depth, No Breadth
Finally, I want to highlight the difference between an ETF's depth and breadth of returns. Based on QQQ's current composition, it's incredible to see how five stocks with a combined 32.01% weighting in QQQ contributed 76.48% of the fund's total returns over the last three years. Nvidia's contribution was 43.18%, so it's definitely a market driven by AI. That's what makes its 5.66% earnings surprise last quarter so disappointing.
The Sunday Investor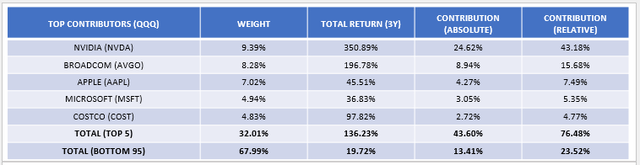
In contrast, the table for SPYV shows that its top 5 stocks contributed to only 32.29% of the portfolio's relative returns based on its current composition. In addition, its bottom holdings gained 22.17% on average, which was better than QQQ's 19.72%.
The Sunday Investor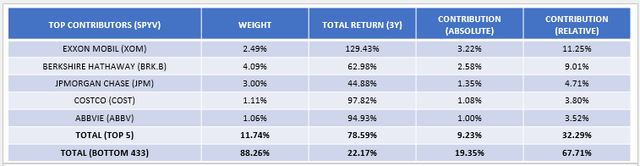
Summary & Conclusion
This article took a comprehensive look at QQQ and challenged the argument that it's overpriced. My findings were mixed, which I believe supports a neutral "hold" rating, and I would ask QQQ bulls and bears to consider the following:
1. QQQ trades at 26.89x forward earnings and 21.29x trailing cash flow, which is high compared to the broader U.S. Equity ETF universe but lower than most large-cap growth ETFs. In exchange, QQQ features stronger growth, quality, momentum, and sentiment than SPY. In this way, its premium valuation is at least partially justified.
2. Alternative size and style segments, such as large-cap value, offer investors a way to reduce risk and valuation but often come with significant sacrifices on other factors. QQQ is resilient because its selections are high-quality, so I caution against trading that in to improve your portfolio's P/E. ETFs like SFY and SPY could be good "baby step" options.
3. Wall Street analysts appear to still favor growth stocks, as evidenced by QQQ and SPYG's stronger EPS Revision Scores compared to value ETFs like SPYV. However, S&P 500 Technology stocks delivered just a 3.2% earnings surprise last quarter, below the 3.6% aggregate average for the Index and well below the figures for defensive sectors like Utilities, Health Care, and Financials. One month of relatively poor results is not a trend, but it could set the stage for a rotation to value like in 2022.
4. QQQ has a lot of depth but no breadth. Based on current weightings, five stocks, led by Nvidia, contributed to 76.48% of the ETF's returns over the last three years compared to 32.29% for SPYV's top five. Importantly, SPYV's bottom contributors actually performed better than QQQ's, so there is potential for a sharp downturn should these stocks start missing expectations.
Again, I've assigned a "hold" rating to QQQ because I think there are several positives and negatives to consider. It's not clear-cut, but I still hope you found this information helpful, and I look forward to your comments below. Thank you for reading.
Disclaimer: Investing carries risk. This is not financial advice. The above content should not be regarded as an offer, recommendation, or solicitation on acquiring or disposing of any financial products, any associated discussions, comments, or posts by author or other users should not be considered as such either. It is solely for general information purpose only, which does not consider your own investment objectives, financial situations or needs. TTM assumes no responsibility or warranty for the accuracy and completeness of the information, investors should do their own research and may seek professional advice before investing.
Most Discussed
- 1
- 2
- 3
- 4
- 5
- 6
- 7
- 8
- 9
- 10