Summary: Southeast Asian ride-hailing and food delivery giant Grab Holdings will release its third-quarter earnings after the U.S. market closes on November 3.
Q2 Review
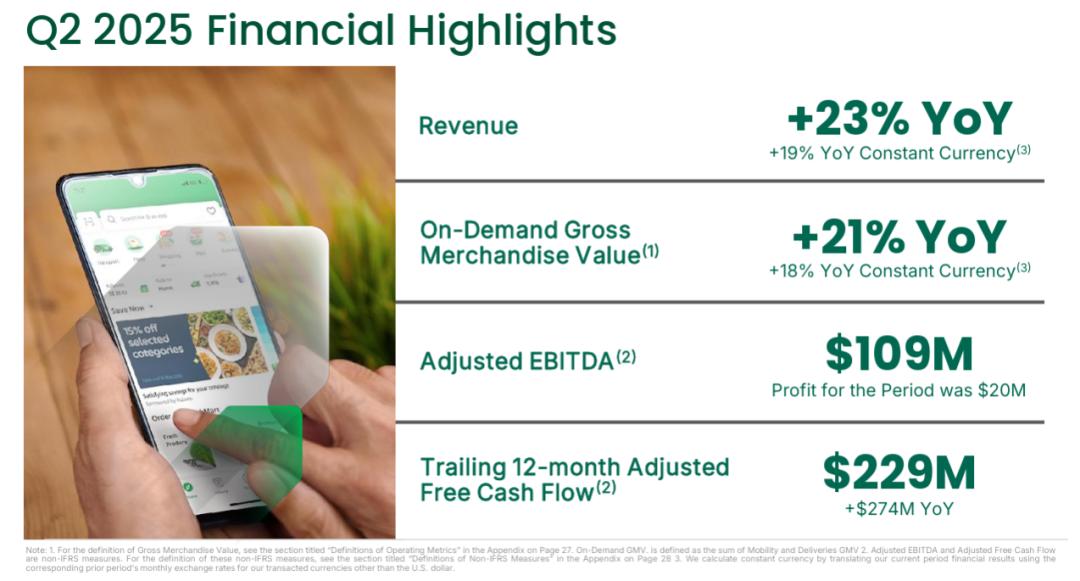
In Q2 2025, Grab's monthly transacting users (MTUs) reached 46.2 million, with revenue growing 23% year-over-year to $819 million. Gross Merchandise Value (GMV) for on-demand services (mobility and deliveries) increased 21% year-over-year to $5.35 billion. Adjusted EBITDA grew for the 14th consecutive quarter, reaching $109 million. The company also achieved a net profit of $20 million, doubling from the previous quarter.
Q3 Expectations
Management guidance for Q3 includes year-over-year revenue growth, stable gross margin range, quarter-over-quarter improvement in adjusted EPS, and continued improvement in net profit supported by operational efficiency optimization.
According to Tiger Trade data, Grab expects total revenue of $872 million, earnings per share of $0.014, and EBIT of $4 million in the third quarter.
Outlook for This Quarter
Resilience in Mobility Demand and Fine-tuning of Supply Management
Q3 saw continued recovery in travel and commuting demand. Institutional previews generally point out that Mobility order volume and pricing resilience are driving revenue. In the Q2 earnings call, management emphasized dynamic balancing between user experience and driver supply, which will continue to be implemented in Q3. This helps reduce waiting times and cancellation rates during peak hours, improving order completion rates, thus positively impacting revenue and gross margin. Combined with preview and research report assumptions, under the seasonal peak, the Mobility segment's GMV and take rate remain stable. Along with subsidy optimization, the profit contribution per order increases, supporting adjusted EPS. If cross-border travel remains stable, this segment's marginal contribution to group revenue is expected to strengthen, increasing market focus on Q3 profit realization, especially on the stability of unit economics during the peak season.
Delivery Efficiency Upgrade and Synergy with Advertising Placement
Deliveries showed a profit margin recovery trajectory in Q2, with multiple performance interpretations emphasizing the platform's structural optimization between dispatch algorithms, merchant subsidies, and user-side delivery fees. Entering Q3, institutional outlooks point to advertising as an important incremental factor: in merchant placement and category operations, the order conversion-based billing model increases the certainty of advertising revenue while reducing reliance on high subsidies. Improved fulfillment efficiency not only brings direct cost reduction but also enhances merchant ROI through more precise traffic distribution, resulting in both revenue and profit margin improvements. Research views generally believe that the Deliveries gross margin maintains an improvement range, coupled with improved advertising conversion rates, providing room for improvement in Q3 adjusted EBITDA and EPS. The core of this path lies in the steady improvement of unit economics, presenting parallel characteristics of revenue growth and profit margin recovery on the financial side, with stronger ability to hedge demand fluctuations.
Stable Operation of Financial Services and Boundary Control of Risk Costs
The Q2 earnings call mentioned that risk costs for financial services were under control, providing a more stable profit base for Q3. Institutional views suggest that the payment closed-loop and risk control model optimization reduce delinquency and loss rates, releasing more capital space available for growth. Combined with the relatively stable macroeconomic environment in Q3, this business forms a mild increase in net profit and adjusted EPS. Management emphasizes the pace of prioritizing profit quality, making Q3 performance more focused on balancing risk and return, and increasing user stickiness and cross-business synergy through penetration with mobility and delivery. If risk control indicators continue to improve as in Q2, market confidence in Q3 net profit margin recovery will strengthen, while laying the foundation for steady growth in subsequent quarters.
Efficiency-Driven Cost Structure Optimization and Improved Profitability Certainty
Multiple institutions emphasize continued operational efficiency optimization in their Q3 outlooks, including vehicle and rider supply-demand matching, shortened fulfillment paths, and automation of customer service and risk control. Q2 results have already reflected positive changes in unit economics, and entering Q3, these improvements will further act on gross margin and net profit. Market views indicate that management's balancing strategy between subsidies and commissions continues, reducing inefficient subsidies, increasing high-quality order flow, and improving the stability of advertising and merchant service revenue. This strategy not only enhances the profit recognition for this quarter but also reduces performance volatility, providing structural support for adjusted EPS. If the optimization path remains consistent, the market will have higher confidence in Q3 performance delivery and full-year guidance credibility, with valuation responding more elastically to profit quality improvements.
Synergistic Impact of Regional Dynamics and Seasonal Factors
Previews and research reports mention that under the recovery environment of major cities and cross-border tourism lines in Q3, regional dynamics may show divergence but remain positive overall. High-frequency orders in core cities are more resilient during peak seasons, with the platform using differentiated rates and supply strategies to shorten waiting times and improve peak-time fulfillment capabilities, thus maintaining stable take rates and gross margins. The positive effects of seasonal factors match advertising placement rhythms, helping to improve merchant exposure and conversion, thereby promoting order density in food and goods delivery. If demand declines in some regions, the platform uses optimized scheduling and subsidy structures as buffers to mitigate the impact on profit margins, demonstrating flexibility in allocation and risk hedging capabilities across different regions.
Cross-Penetration and Enhancement of User Lifetime Value
Institutions consistently emphasize the enhancement of user lifetime value through cross-penetration between mobility, delivery, and financial services. In Q3, under the combination of membership benefits, targeted subsidies, and payment discounts, active user rates and repurchase frequency increase, supporting order density and advertising placement effectiveness. Conversion-based advertising billing improves merchant ROI, encouraging more merchants to participate in platform promotions and recommended position optimization, forming a stable revenue increment. Improved user retention across multiple business scenarios allows the platform to reduce customer acquisition costs and improve overall unit economics, ultimately reflected in continuous recovery of gross margin and adjusted EPS.
Conclusion
The core focus for Q3 is on continued optimization of unit economics and improvement in profit quality. The Mobility segment, with peak season and supply fine-tuning, sees order completion rates and pricing resilience supporting revenue and gross margins. The Delivery segment achieves dual improvement in cost structure and revenue quality through fulfillment efficiency upgrades and conversion-based advertising synergy. Financial services continue to control risk costs, providing a solid profit base for overall performance.
Institutional views generally believe there is room for improvement in adjusted EPS, with management having more confidence in the continuity of gross margin and profit recovery. From Q2 performance and Q3 outlook, Grab's growth path emphasizes both efficiency and quality. If this direction is validated, it will be conducive to enhancing market trust in full-year guidance and expectations for subsequent operational performance.